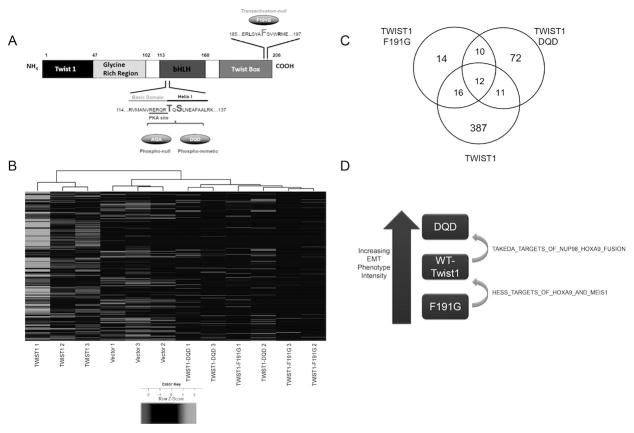
Figure 1. Gene expression profiling of TWIST1 structure-function mutants revealed HOXA9 as a downstream target.
(A) Schematic of TWIST1 structure, T125D and S127D site-specific mutant, TWIST1-DQD, TWIST1-F191G. (B) Unsupervised hierarchal clustering heatmap visualization of gene expression differentially regulated by vector, TWIST1, TWIST1-DQD, and TWIST1-F191G. (C) Venn diagram represents significantly differentially expressed genes between Myc-CaP-TWIST1 and TWIST1 mutants. (D) GSEA analysis revealed that HOXA9 gene signatures were correlated with an increased EMT and metastatic phenotype.

