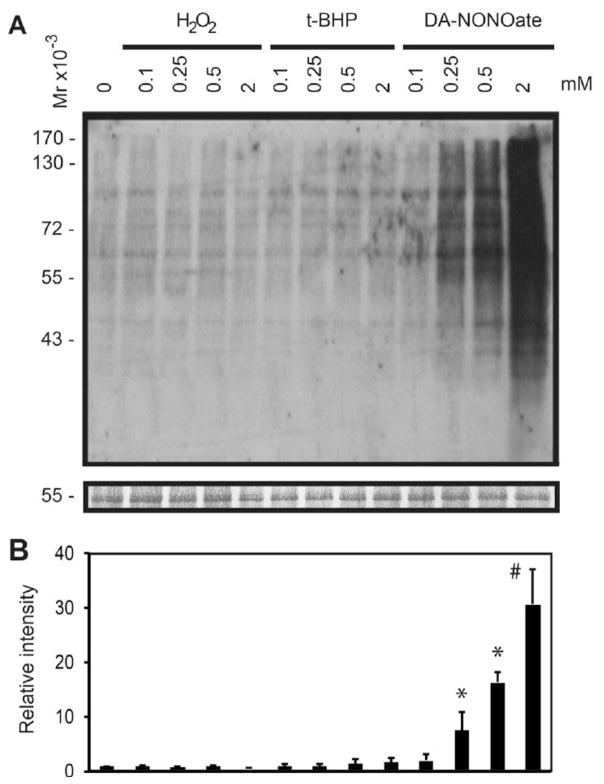
Figure 4. Dose dependent increase of tyrosine nitration in human spermatozoa following treatment with ROS.
A) Spermatozoa were treated with increasing concentrations of H2O2, tert-BHP, or DA-NONOate and immunoblotted with an anti-nitrotyrosine antibody. B) Relative intensity of tyrosine nitrated proteins. The density value of bands from sample incubated without ROS (0 mM) was used to normalize the values obtained with the other samples. Relative intensity of bands is presented as the mean ± SEM. Membranes were silver stained to confirm equal loading between lanes (band at 55kDa is shown in the bottom panel). Representative blot from 4 other experiments done with different donors (n=5). #means the highest value, *means higher than control (0 mM).

