
Fig. 2.
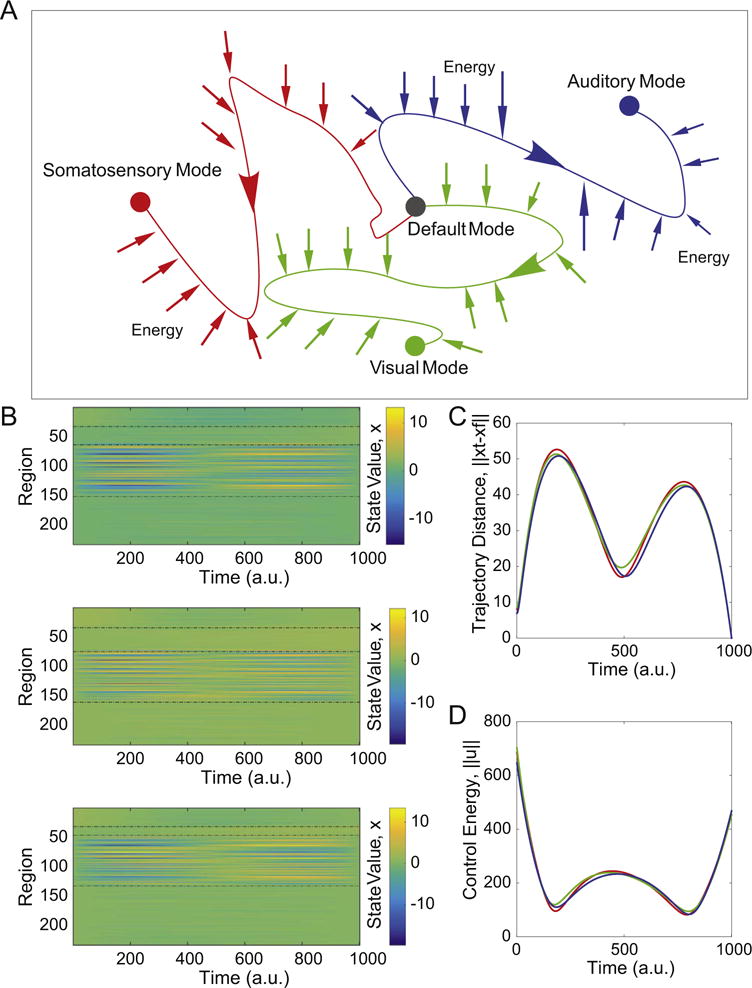
Optimal control trajectories. (A) We study 3 distinct types of state transitions in which the initial state is characterized by high activity in the default mode system, and the target states are characterized by high activity in auditory (blue), extended visual (green), or motor (red) systems. (B) The activation profiles of all N=234 brain regions as a function of time along the optimal control trajectory, illustrating that activity magnitudes vary by region and by time. Activation can be either positive or negative, and the exact range of values will depend on the initial state, the target state, and the control set. Regions are listed in the following order: initial state, target state, controllers, and others. (C) The average distance from the current state x(t) to the target state x(T) as a function of time for the trajectories from the default mode system to the auditory, visual, and motor systems, illustrating behavior in the large state space. (D) The average control energy utilized by the control set as a function of time for the trajectories from the default mode system to the auditory, visual, and motor systems. The similarity of the curves observed in panels (C) and (D) is driven largely by the fact that they share the same control set. See Fig. S2(B) for additional information on the range of these control energy values along the trajectories. Colors representing target states are identical in panels (A), (C), and (D).