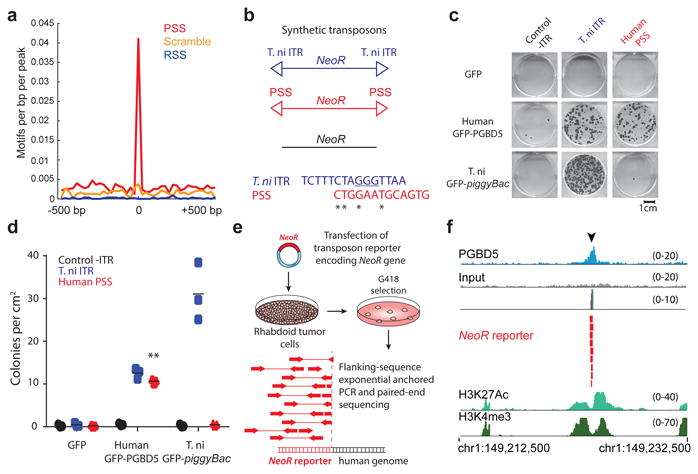
Fig. 2. PGBD5 is physically associated with human genomic PSS sequences that are sufficient to mediate DNA rearrangements in rhabdoid tumor cells.

(a) Genomic distribution of PGBD5 protein in G401 rhabdoid tumor cells as a function of enrichment of PSS (red) as compared to scrambled PSS (orange) and RAG1 recombination signal sequence (RSS, blue) controls as measured using PGBD5 ChIP-seq (p = 2.9 × 10⁻²⁹ for PSS, p = 0.28 for scrambled PSS, p = 1.0 for RSS by hypergeometric test). (b) Schematic of synthetic transposon substrates used for DNA transposition assays, including transposons with T. ni ITR marked by triangles in blue, transposons with PGBD5-specific signal sequence (PSS) marked by triangles in red and transposons lacking ITRs marked in black (top) and sequence alignment of T. ni ITR compared to human PSS (bottom). (c) Representative photographs of Crystal violet-stained colonies obtained upon G418 selection in the transposon reporter assay. (d) Genomic DNA transposition assay as measured using neomycin resistance clonogenic assays in HEK293 cells co-transfected with human GFP-PGBD5 or control GFP and T.ni GFP-PiggyBac, and transposon reporters encoding the neomycin resistance gene flanked by human PSS (red), as compared to control reporters lacking inverted terminal repeats (-ITR, black) and T. ni piggyBac ITR (blue). ** p = 5.0 × 10⁻⁵. Lepidopteran T. ni PiggyBac DNA transposase and its piggyBac ITR serve as specificity controls. Errors bars represent standard deviations of three independent experiments. (e) Schematic model of transposition reporter assay in G401 rhabdoid tumor cells followed by flanking sequence exponential anchored-polymerase chain reaction (FLEA-PCR) and Illumina paired-end sequencing. (f) Genomic integration of synthetic NeoR transposons (red) by endogenous PGBD5 in G401 rhabdoid tumor cells at PSS site (arrowhead), as shown in the ChIP-seq genome track of PGBD5 (blue), as compared to its sequencing input (gray), and H3K27Ac and H3K4me3 (bottom), consistent with the bound PGBD5 transposase protein complex.
