
Figure 2.
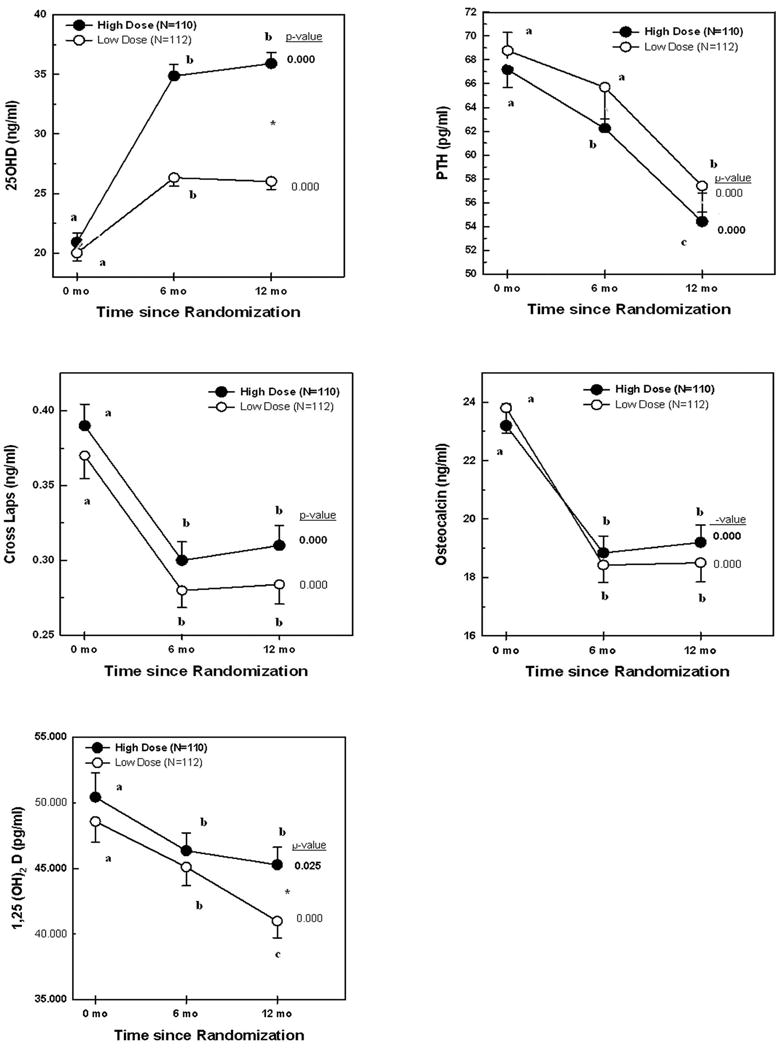
25OHD, PTH, Cross Laps, osteocalcin, and 1,25(OH)2D levels by vitamin D supplementation high dose (closed circles) and low dose (open circles) groups. Numbers expressed as mean ± SEM. P-values depicted in the Figure are derived from repeated measures ANOVA within each treatment group. Values within each treatment group depicted with different letters are significantly different from each other in post-hoc analyses by ANOVA. *p<0.05 by independent t-test for 25OHD and 1,25(OH)2 D at 12 months.