
Figure 3.
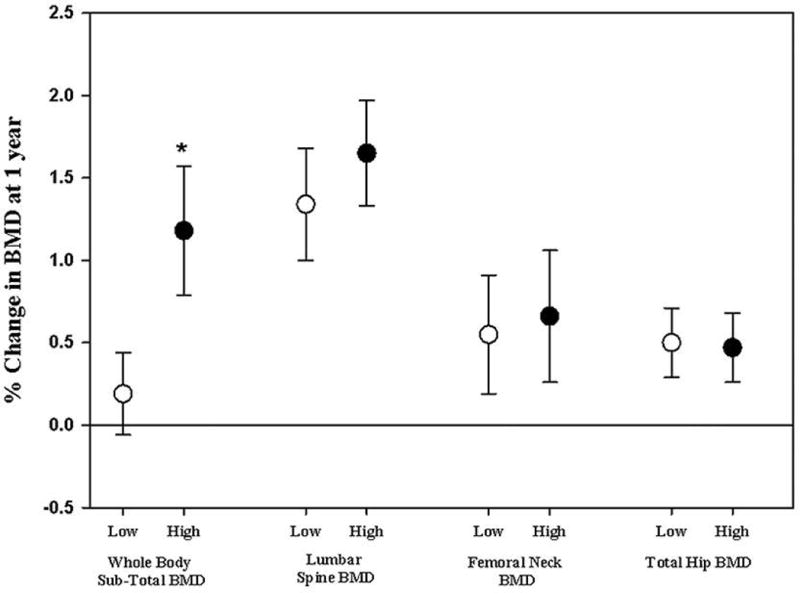
Percent change in BMD at 12 months, at various skeletal sites, by vitamin D treatment dose. Numbers expressed as mean ± SEM. BMD increased significantly at 12 months both at spine and total hip in both treatment groups, and at the sub-total BMD in the high dose treatment arm only. * p<0.05 for the % change at 12 months low dose vs. high dose by independent t-test.