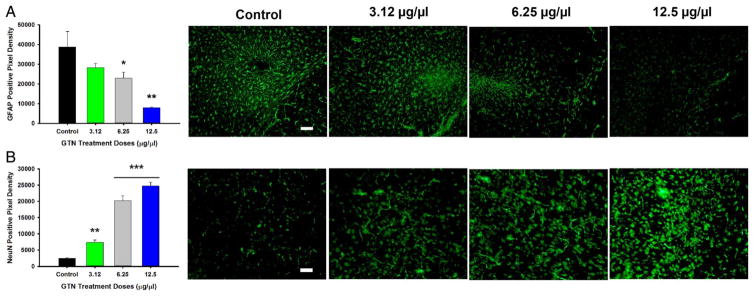
Figure 4.
Graphs and images for immunohistochemistry, magnification at 20× with quantification of positive pixel density. (A) Graph depicting positive pixel for GFAP control versus GTN-treated doses in infarcted region with representative images. (B) Graph depicting positive pixels for NeuN stain for control versus GTN treated doses in infarcted region with representative images (n=5 per group). Scale bar=100 μm. *p<0.05; **p<0.001; ***p<0.0001. GFAP, glial fibrillary activating protein; GTN, glyceryl trinitrate.

