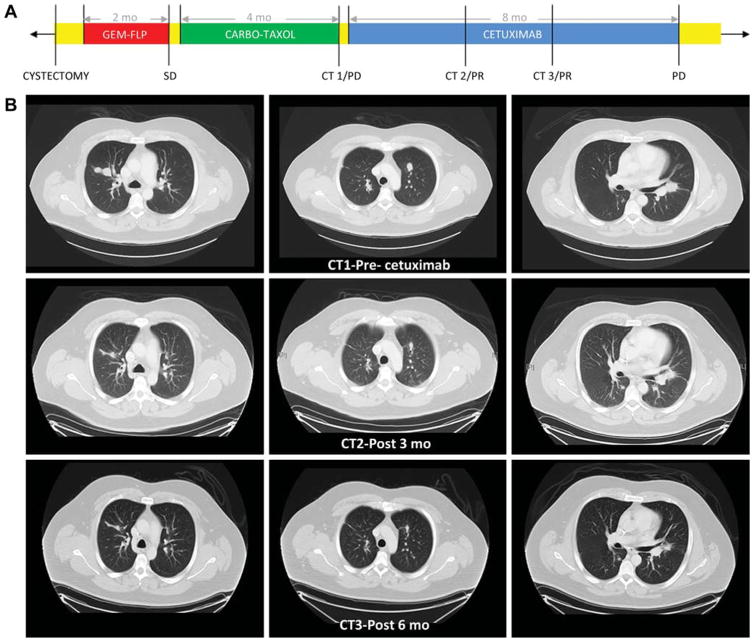
Fig. 1.
Clinical information for the index patient. (A) Timeline demonstrating treatment course. CT = computed tomography scan; SD = stable disease; PR = partial response; PD = progression of disease. Yellow represents periods without chemotherapy treatment. (B) CT images of lung metastases before and after 3 and 6 mo of cetuximab treatment.

