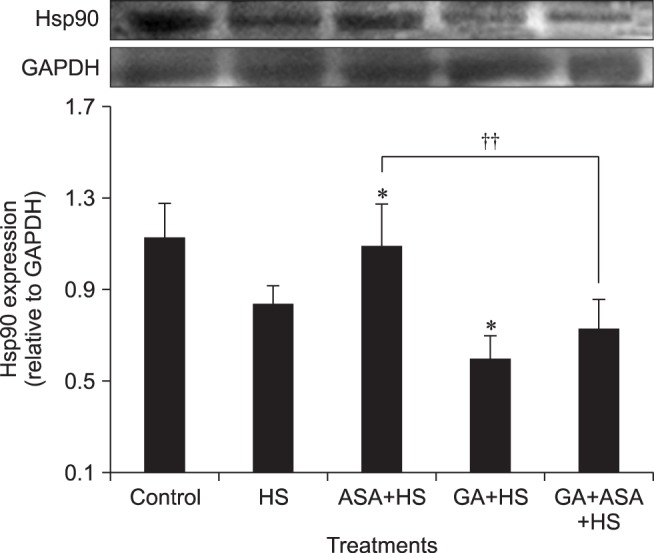
Fig. 5. Effect of different treatments on Hsp90 expression in chicken primary myocardial cells exposed to heat stress. The difference of the data of cells with different treatments (excluding the data of untreated cells) vs. that of heat-stressed cells are indicated by *p < 0.05. The difference of the data of cells treated by acetylsalicylic acid (ASA)+heat stress (HS) and geldanamycin (GA)+HS vs. that of cells treated by GA+ASA+HS is indicated by ††p < 0.01.

