. 2017 Jun 22;18(2):159–167. doi: 10.4142/jvs.2017.18.2.159

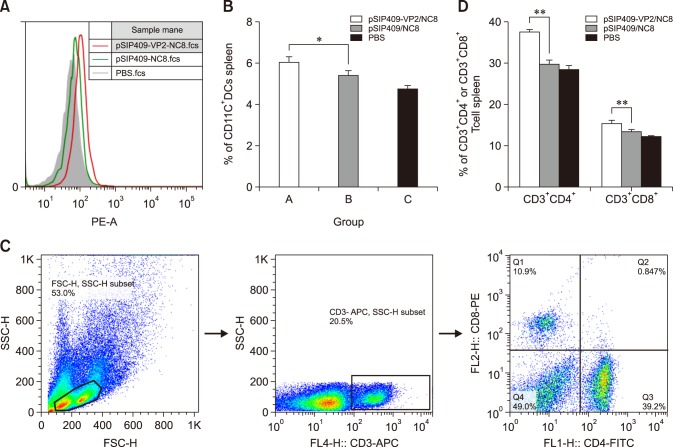
Fig. 6. CD11c, CD4, and CD8 expressions in immunized mice. Group A, pSIP409-VP2/NC8; Group B, pSIP409/NC8; Group C, phosphate-buffered saline (PBS). (A) Histograms show flow cytometry result (on isolated cells from spleen) from mice administered pSIP409-VP2/NC8 (thick red line) in comparison with the mice administered pSIP409/NC8 (thick green line) or PBS (filled histograms with gray color). (B) The CD11c+ levels of Group A were significantly different from those of Group B (*p < 0.05). (C) Gate strategy. (D) There were significantly different percentages of CD3+CD4+ and CD3+CD8+ cells between Groups A, B and C (**p < 0.01). On average, there were greater changes in CD11c+-, CD4+-, and CD8+-expressing spleen lymphocytes in Group A than in the other test groups. The data are expressed as mean ± SEM values from triplicate experiments. n = 3 mice per group.

Fig. 6