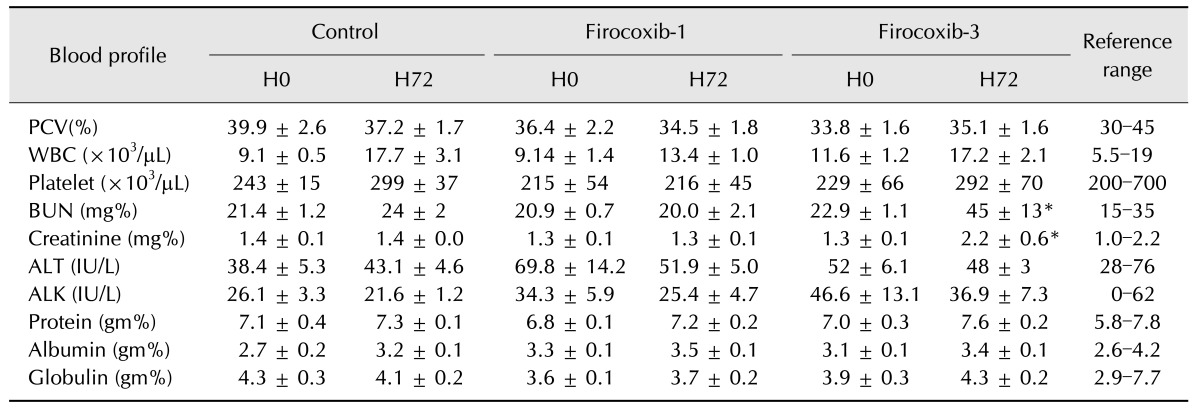
Table 3. Hemogram and blood chemistry analysis of cats in the present study (mean ± SEM).
H0, baseline value; H72, 72 h post-operation value; PCV, packed cell volume; WBC, white blood cell; BUN, blood urea nitrogen; ALT, alanine aminotransferase; ALK, alkaline phosphatase. *p < 0.05 compared to baseline.

