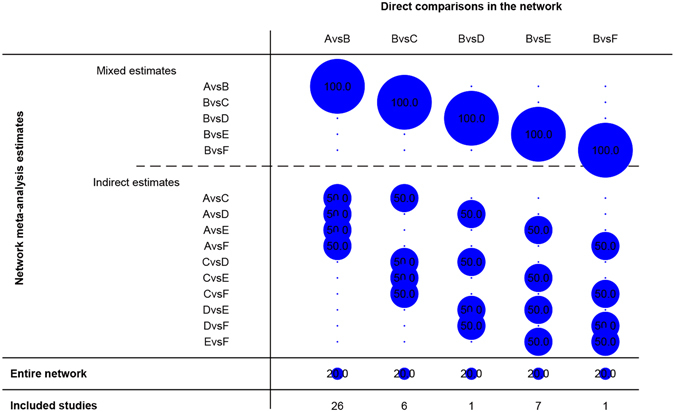
Figure 10.

Network Contribution Graph: as for A vs B, for example, the contribute proportion of “A vs B” for “A vs B” is 100%, and for “A vs C”, “A vs D”, “A vs E” and “A vs F” was 50% respectively. The contribute proportion for entire network was 20% and 26 clinical studies included. Note: (A) cinobufotalin injection + TACE; (B) TACE; (C) Jinlong capsule + TACE; (D) Aidi injection + TACE; (E) Sodium Cantharidinate and Vitamin B6 Injection + TACE; F: Sodium Demethylcantharidate (SNCTD) + TACE.
