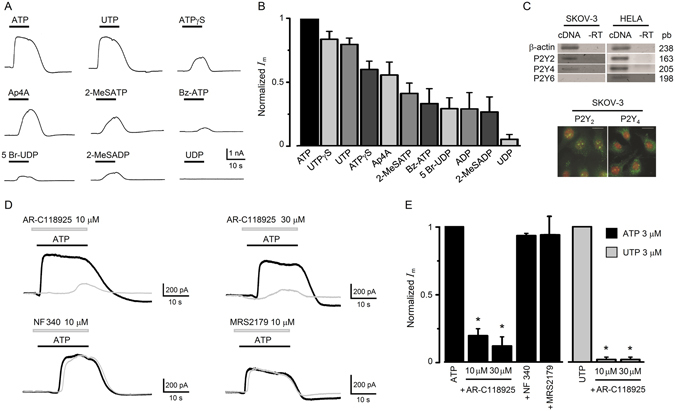
Figure 3.

Purinergic pharmacology and expression of the receptor involved in the electrical response in SKOV-3 cells. (A) A battery of different agonists (all applied at 3 µM) for purinergic receptors was tested in cells held at −40 mV, and the peak current amplitude for each agonist was normalized against that obtained by applying ATP. This resulted in the potency sequence illustrated in graph (B) where data obtained in 50 cells are summarized. (C) The upper panel shows the PCR analysis for P2Y receptors sensitive to ATP/UTP; P2Y2, P2Y4 and P2Y6 receptor subtypes. In SKOV-3 cells, bands with the expected size were obtained for P2Y2 and P2Y4 subtypes but not for P2Y6 (mRNA from HELA cells was used as positive control, and -RT indicates the corresponding reaction control without reverse transcriptase). The images show immunorecognition for P2Y2 or P2Y4 receptor proteins in SKOV-3 cells observed by epifluorescence (P2Y receptor in green and nuclei in red labeled with propidium iodide). Scale bar 10 µm. (D) Traces illustrate the effect of AR-C118925, NF340, or MRS2179, antagonists of P2Y2, P2Y1 or P2Y11 receptor, respectively. Each set of records corresponds to the current response elicited by ATP (3 µM; black trace) alone or in the presence of an antagonist (gray trace) as indicated. (E) The graph summarizes the results obtained in experiments as in (D). Each bar corresponds to the current amplitude in every condition (n = 16) normalized against the current obtained by applying ATP alone. The graph also shows results of using UTP as agonist and AR-C118925 as antagonist (n = 16; *p < 0.05).
