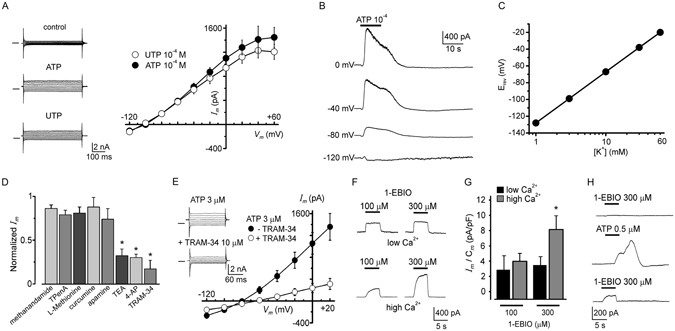
Figure 4.

Ionic basis of the outward current elicited by ATP and effect of K+ channel modulators. (A) Current responses obtained by applying voltage pulses, from −120 to +60 mV in 20 mV steps, to a SKOV-3 cell held at −40 mV. Currents during superfusion in control conditions (upper traces) and at the outward component peak elicited either by ATP (middle traces) or UTP (lower traces). Control currents were subtracted from those obtained at the peak response, and the amplitude values were plotted against the respective membrane voltage; the linear I/V relationship obtained (23 cells) showed a reversal membrane potential close to −100 mV. (B) Traces illustrate an example of current responses elicited by ATP while a cell was held at different values as indicated, confirming a linear I/V relationship and the Erev estimation for the outward component. (C) Relationship between Erev (estimated as in (A) and external K+ concentration; line is the Nernst relationship considering internal and external concentrations in each case. Data represent means ± SEM of 10–15 cells. (D) A battery for distinct K+-channel inhibitors was tested on the response, including non-specific blockers of K+ channels (TEA+ and 4-AP), those specific for two-pore K+ channels, and blockers apamin and TRAM-34 specific for KCa2 and KCa3.1, respectively; bars indicate the proportion of current inhibited by the different antagonists (*p < 0.05). (E) Traces show membrane current recorded during the outward peak response to ATP (upper traces) and that obtained in the same cell by co-applying ATP together with TRAM-34 (10 µM), a specific blocker of KCa3.1 channels (lower traces). The graph shows data (means ± SEM) obtained in 30 cells under the same protocol in which the basal currents were subtracted for each case, averaged and plotted. (F) Currents elicited by 1-EBIO (100 or 300 µM), a K+ channel opener specific for KCa3.1 channels, applied at two different intracellular Ca2+ concentrations: low and high (estimated concentration of 10 and 300 nM, respectively). The bar graph shows the averaged current density obtained in each condition monitored in 14 cells. (G) Traces illustrate a case in which initially, 1-EBIO was unable to generate any current (upper trace); however, after a response elicited by ATP, a second application of 1-EBIO (lower trace) at the same concentration generated a meaningful outward response.
