Figure 5.

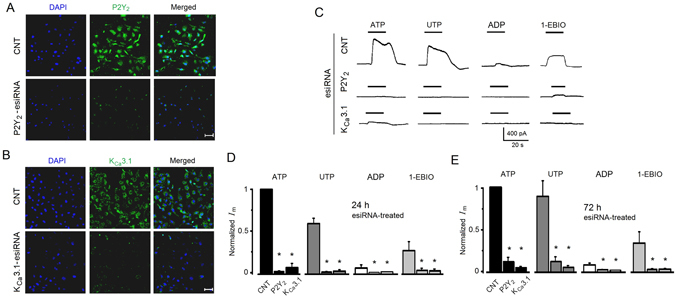
P2Y2 and KCa3.1 protein expression and electric response to agonists in esiRNA transfected SKOV-3 cells. (A) Analysis by immunocytochemistry after 48 h of esiRNA treatment in control (CNT) and P2Y2-esiRNA-treated groups. Panels show the fluorescence signal for DAPI (blue) in the first column, the signal obtained with a specific antibody against P2Y2 receptor protein (in green) in the second column, and the corresponding merged image. (B) Similar analysis was made in KCa3.1-esiRNA-treated cells using an antibody against KCa3.1 channel protein (in A and B bar = 50 µm). (C) Traces illustrate current response elicited by agonists (all 3 µM) or 1-EBIO (300 µM) in SKOV-3 cells 24 h after esiRNA transfection. In (D and E) traces illustrate current responses in SKOV-3 cells 24 h and 72 h after esiRNA transfection, respectively. Currents were normalized against the ATP-elicited response in the CNT group (18–19 cells in each condition). Every set of bars corresponds to either CNT, P2Y2-esiRNA, or KCa3.1-esiRNA as indicated in the group for ATP application (*p < 0.05, experimental condition vs. respective CNT).
