
Figure 3.
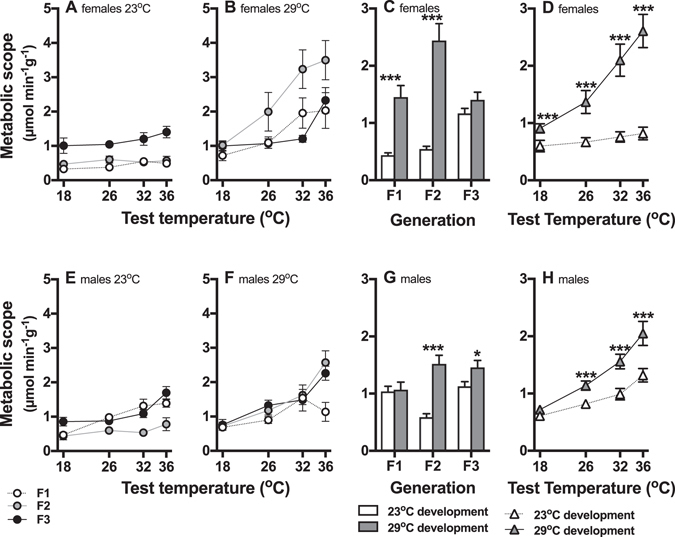
Metabolic scope of fish across generations in different stable environments (Experiment 1). The top row of panels shows means at different test temperatures (±s.e.; A,B) and interaction plots of marginal means (±s.e.) for significant interactions (C,D) for females, and the bottom row shows means (E,F) and interaction plots (G,H) of males. In females, metabolic scope was determined by interactions between generations (F1 = open circles, F2 = grey circles, F3 = black circles) and developmental conditions (A: 23 °C development, B: 29 °C development), and between developmental temperature and test temperature. The interaction plots show that metabolic scope differed significantly between developmental treatments in the F1 and F2 generations but not in F3 generation (C; open bars = 23 °C developmental temperature, filled bars = 29 °C developmental temperature), and that fish developed at 29 °C (D; filled triangles) had greater metabolic scope than those developed at 23 °C (open triangles). In males, metabolic scope was determined by a three-way interaction between generation, developmental temperature (E: 23 °C development, F: 29 °C development), and test temperature. In the opposite patterns to females, in males metabolic scope differed between developmental treatments in the F2 and F3 generations but not in the F1 generation (G). Metabolic scope was significantly higher in fish from the 29 °C developmental temperature treatment at 26 °C, 32 °C and 36 °C test temperatures (H; open triangles = 23 °C developmental temperature, filled triangles = 29 °C developmental temperature). N = 8–9 fish per treatment group; * p < 0.05, ** p < 0.01, *** p < 0.001.