Figure 2.

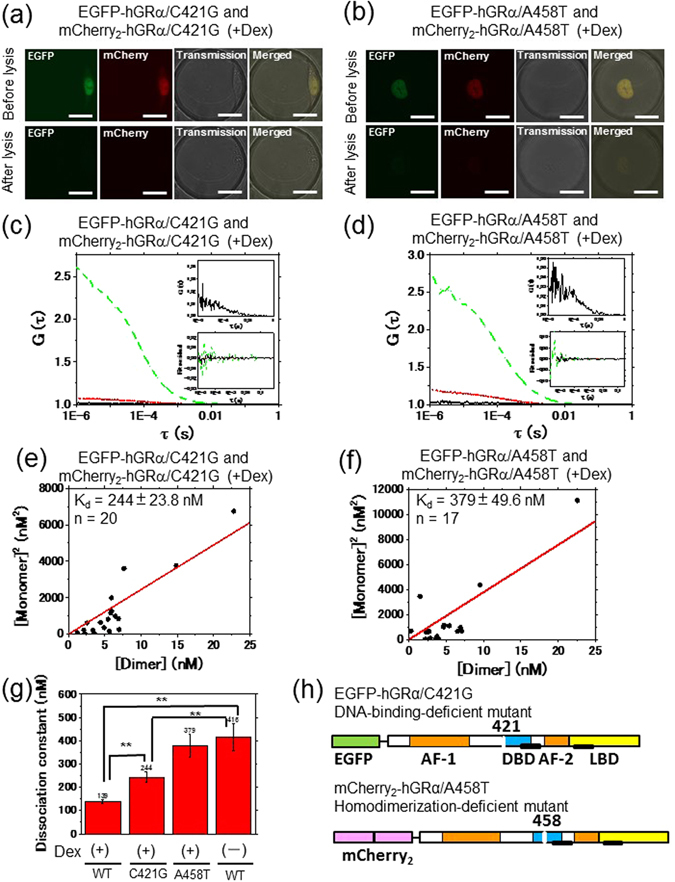
Determination of in vitro Kd of GRα mutants using the FCCS-microwell system. Typical auto- and cross-correlation curves constructed by measurements in microwells after lysis of U2OS cells coexpressing EGFP-hGRα mutants and mCherry2-hGRα mutants in the presence of Dex. The green dashed line, red dotted line, and black solid line denote the autocorrelation of the green channel [G G(τ)], autocorrelation of the red channel [G R(τ)], and cross-correlation [G C(τ)], respectively. The insets show an enlarged graph of the cross-correlation curve and fitting residuals of autocorrelation and cross-correlation curves. LSM images of U2OS cells coexpressing EGFP-hGRα mutants and mCherry2-hGRα mutants before and after cell lysis in a microwell for the C421G mutant (a) and A458T mutant (b). The scale bar is 20 μm. FCCS was performed in a microwell after cell lysis for the C421G mutant (c) and A458T mutant (d) in the presence of Dex. (e, f) Results of Kd determination using a scatter plot and linear regression. The plots represent the square of the concentration of the monomeric hGRα versus the concentration of the dimer of hGRα. The solid red line shows the linear fit. The slope indicates Kd. (e) The C421G mutant in the presence of Dex. (f) The A458T mutant in the presence of Dex. (g) A summary of in vitro Kd values determined using the FCCS-microwell system. WT: wild type, C421G: the C421G mutant, A458T: the A458T mutant. Statistical analysis was based on ANOVA (**p < 0.01) (h) A schematic diagram of mCherry2- and EGFP-fused constructs of mutated hGR, C421G (DNA-binding-deficient mutant) and A458T (homodimerization-deficient mutant).
