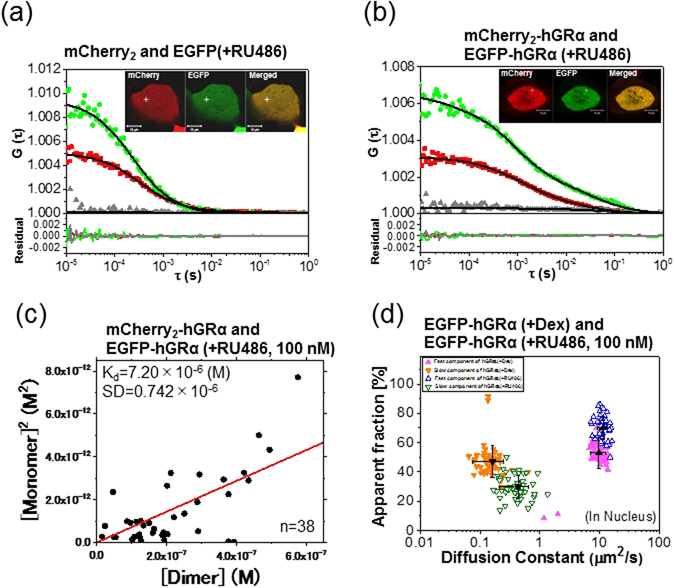
Figure 4.

The effect of RU486 on GRα analyzed by FCCS. Typical auto- and cross-correlation curves obtained from U2OS cells coexpressing the pairs of chimeric fusion proteins before and after addition of the ligand. The filled green diamonds, red squares, and gray triangles denote autocorrelation of the green channel [G G(τ)], autocorrelation of the red channel [G R(τ)], and the cross-correlation curve [G C (τ)], respectively, with their fits (solid black lines) and residuals. The insets show LSM images of U2OS cells coexpressing the pairs of chimeric fusion proteins. Measurement positions of FCCS are indicated by the white crosshairs. The scale bars are 10 μm. FCCS was performed in U2OS cells expressing (a) mCherry2 and EGFP as a negative control, after addition of RU486 and showing a flat cross-correlation amplitude; (b) U2OS cells coexpressing mCherry2-hGRα and EGFP-hGRα in the nucleus 20 min after addition of 100 nM RU486. (c) The Kd plot represents the square of the concentrations of the monomeric hGRα versus the concentration of the dimer of hGRα after addition of RU486. The solid line shows the linear fit. (d) The scatter plots represent the diffusion constants versus their fractions from fitting analysis of FCCS data with a two-component model. Black symbols indicate the average of the diffusion constants of the fast and slow components. The data are presented as mean ± SD. Fast and slow components are shown with different colors and symbols. EGFP-hGRα after addition of Dex (filled symbols) and RU486 (open symbols).
