
Fig. 1.
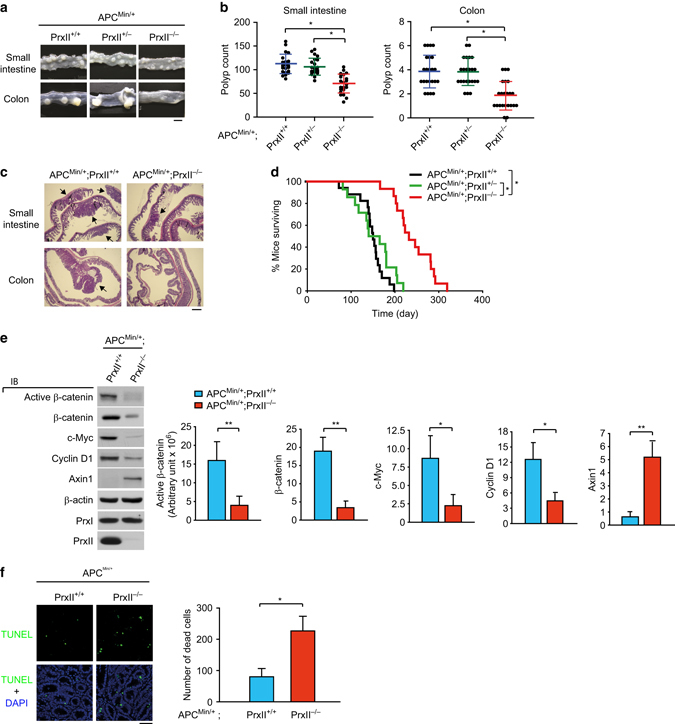
Loss of PrxII suppresses intestinal tumorigenesis and increases survival in APC-mutant mice. a Representative photomicrographs of longitudinally opened intestinal tissues from APC Min/+ ;PrxII +/+, APC Min/+ ;PrxII +/−, and APC Min/+ ;PrxII −/− mice. Scale bar, 5 mm. b Macroscopic polyps (>3 mm in diameter) were counted in whole-mount intestinal tissues from APC Min/+ ;PrxII +/+, APC Min/+ ;PrxII +/−, and APC Min/+ ;PrxII −/− mice. Dot plots represent the average polyp numbers ± s.d. (n = 23 mice per group, *P < 0.001 with repeated-measures ANOVA). c Cross sections of frozen small intestines and colons from APC Min/+ ;PrxII +/+ and APC Min/+ ;PrxII −/− mice were stained by hematoxylin and eosin. Arrows indicate the polyps. Scale bar, 1 mm. d Kaplan–Meier plot showing the survival of APC Min/+ ;PrxII +/+ (n = 17), APC Min/+ ;PrxII +/− (n = 14), and APC Min/+ ;PrxII −/− (n = 15) mice (*P < 0.001 with Log rank test). e Intestinal polyps from APC Min/+ ;PrxII +/+ and APC Min/+ ;PrxII −/− mice were homogenized and immunoblotted (IB) for indicated proteins. Data in the graph are means ± s.d. of the intensities of immunoreactive bands after being normalized with control β-actin level (n = 3, *P < 0.05, **P < 0.01). f Cell death in the intestinal polyps from APC Min/+ ;PrxII +/+ and APC Min/+ ;PrxII −/− mice was measured by TUNEL staining. Nuclei were stained with DAPI. Data in the graph are means ± s.d. of the number of TUNEL-positive cells per mm2 (n = 9 mice per group, *P < 0.01). Scale bar, 50 μm