
Figure 1.
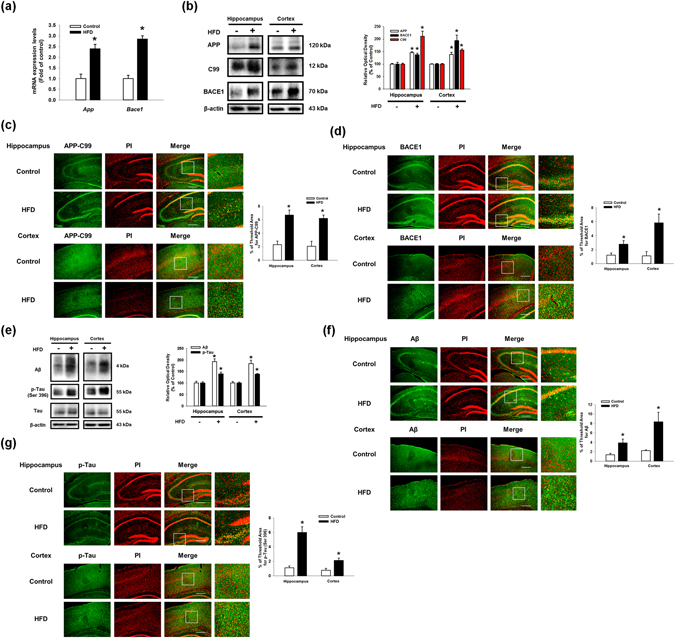
Effect of HFD on the regulation of Aβ regulating proteins expressions and Aβ production in the mouse brain. (a) Brains of 13 weeks old C57BL/6 mouse, which were fed with HFD for 8 weeks, were extracted. mRNA expressions of APP and BACE1 in brain samples were analyzed by quantitative real time PCR. Data were normalized by ACTB mRNA expression level. Data are reported as a mean ± S.E.M. n = 4. (b) Extracted brains were cryo-sectioned coronally, and separated into hippocampus and cortex. The expressions of APP, C99, BACE1 and β-actin in hippocampus and cortex regions were analyzed by western blot. Data are reported as a mean ± S.E.M. n = 5. (c,d) Brain samples for immunohistochemistry were immunostained with C99 and BACE1 antibodies and PI. Images shown in result are representative. All scale bars, 150 μm (magnification, ×200). (e) Aβ, p-Tau (Ser396), Tau and β-actin protein expression levels in hippocampus and cortex regions of brain were assessed with western blot. (f,g) Brain samples for immunohistochemistry were immunostained with Aβ and p-Tau (Ser396) antibodies and PI. Image shown in result are representative. All scale bars, 150 μm (magnification, ×200). Each blot result shown is representative image. Quantitative blot data are presented as a mean ± S.E.M. n = 5. *p < 0.05 versus control.