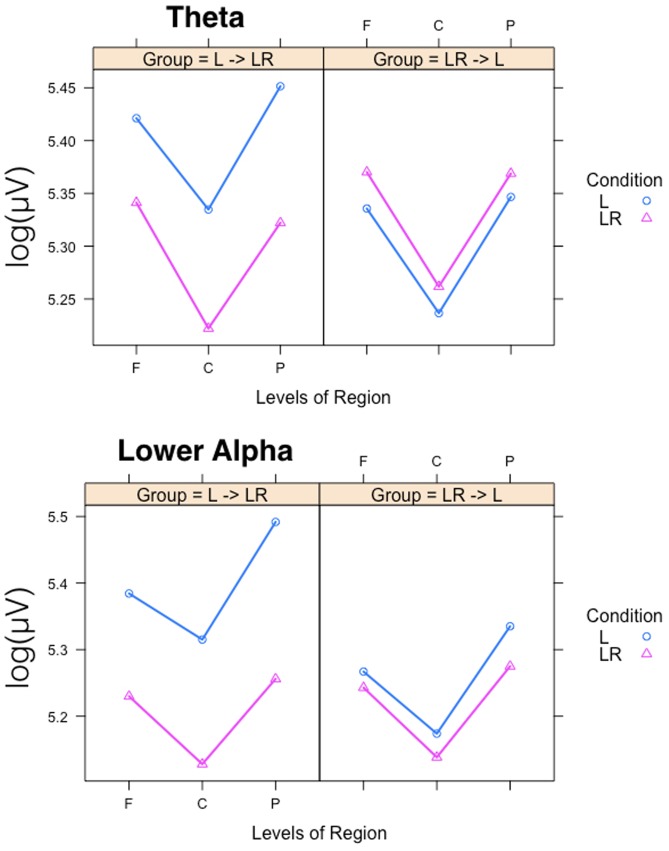
FIGURE 4.
Interaction plots for the partly significant three-way Group × Condition × Region interactions for the theta and lower alpha band. Abscissa depicting the different positions in the fronto-parietal direction (F = frontal, C = central, P = parietal). The colored lines indicate the different Conditions: L (blue) = Listening, LR (red) = Listening and Rating. The left panel shows the results for the Group starting with Listening and Rating and continuing with Listening; the right panel shows the results for the Group starting with Listening and continuing with Listening and Rating.

