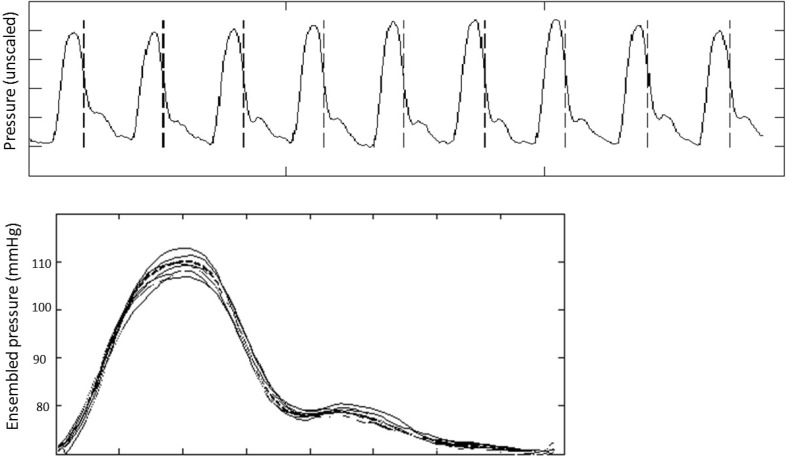
Fig. 3.
Central pressure obtained from the Pulsecor device (upper panel) and ensemble-averaged signal (lower panel). Upper panel raw data from the suprasystolic blood pressure system with the minimum dPdt for each cardiac cycle marked with dashed vertical lines and signals are ensembled according to these fiducial points. Lower panel ensemble average (dashed line) with the individual aligned waveforms (solid lines). Reproduced from Broyd et al. [5]

