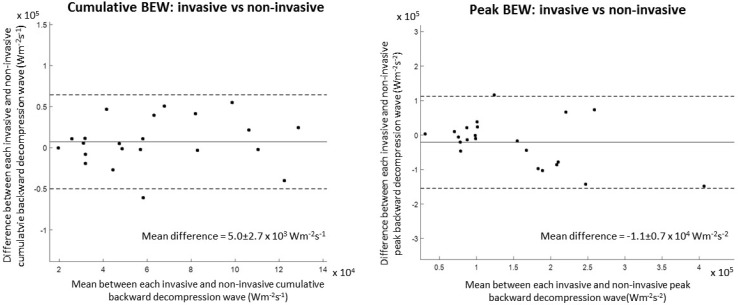
Fig. 5.
Bland Altman plot of invasive versus non-invasive backward decompression wave: peak (left) and cumulative (right), Solid horizontal line represents mean difference and dashed lines the limit of agreement (±1.96 × SD). Reproduced from Broyd et al. [5]

