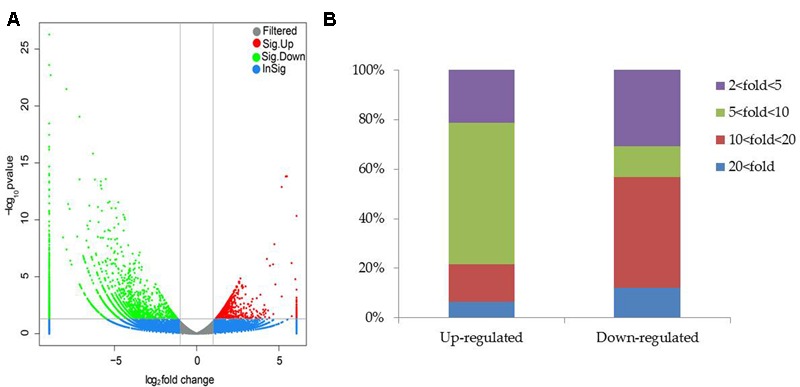
FIGURE 6.

Distribution of differentially expressed genes between the non-inoculated (NI) and inoculated (I) libraries. (A) Scatter plot of gene expression difference. Green and red dots indicate up- and down-regulated genes under saline–alkaline stress, respectively. Blue dots indicate genes without significant differential expression, and gray dots indicate genes that were filtered out low quality reads. (B) Statistics of DEGs. Different color column indicated DEGs with diverse fold changes.
