
FIGURE 9.
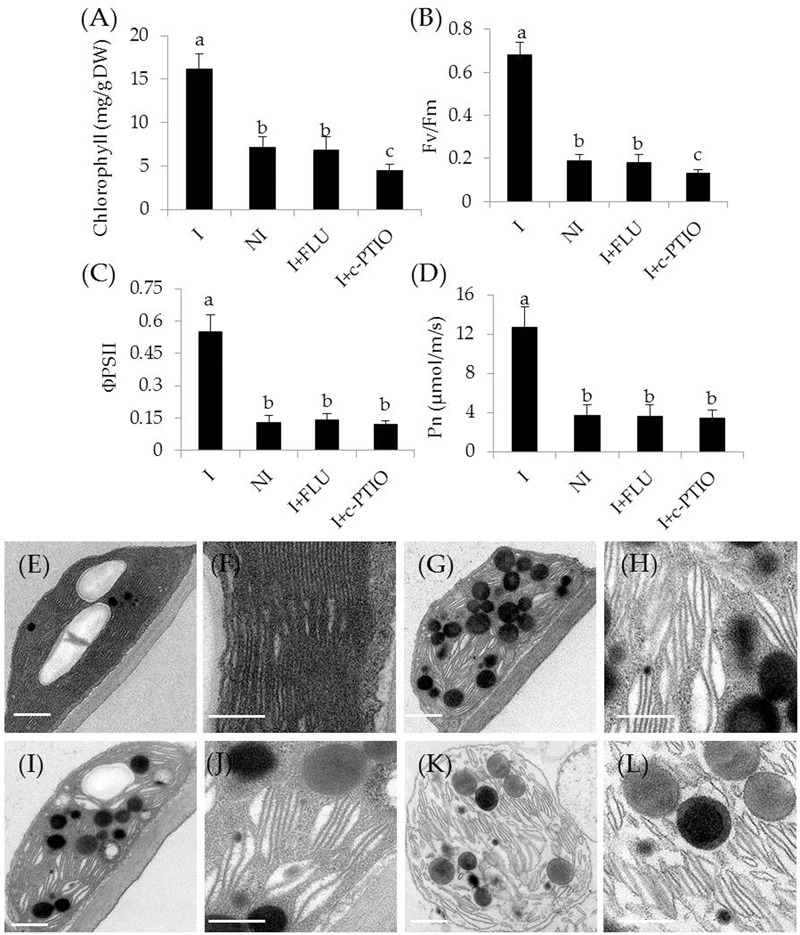
Treatment with FLU or c-PTIO affected (A) total chlorophyll content, (B) Fv/Fm, (C) ΦPSII, and (D) Pn. In addition, chloroplast ultrastructure of the non-inoculated and inoculated plants: (E) the inoculated plants, (G) the non-inoculated plants, and (I) FLU- or (K) c-PTIO-treated inoculated plants. (F,H,J,L) Indicated locally amplified views in (E,G,I,K), respectively. Scale bar = 1 μm. Treatments and statistical analysis were as described in Figure 8.