FIGURE 10.
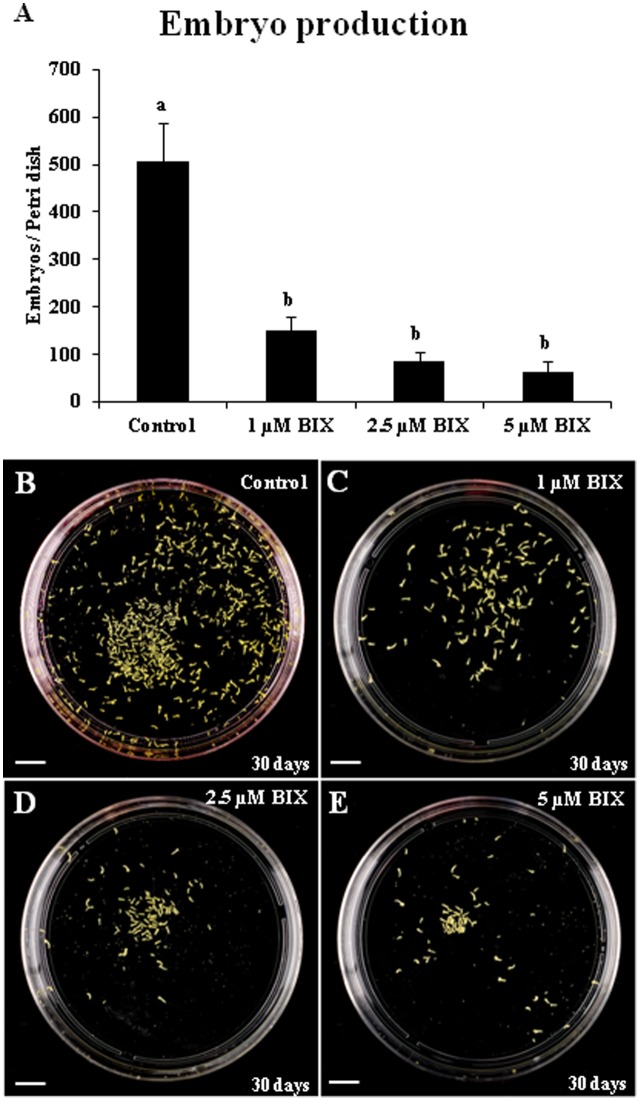
Effects of BIX-01294 long treatments on microspore-derived embryo production of Brassica napus. (A): Quantification of the embryo production in control and BIX-treated cultures at 1, 2.5, and 5 μM concentrations. Columns represent mean values (±SEM) of the total number of embryos per Petri dish. Different letters on columns indicate significant differences according to ANOVA and Tukey’s tests at p < 0.05. (B–E): Representative plates showing the microspore-derived embryos produced in control (B) and BIX-treated cultures at 1 μM (C), 2.5 μM (D) and 5 μM (E) concentrations, after 30 days. Bars represent 10 mm.

