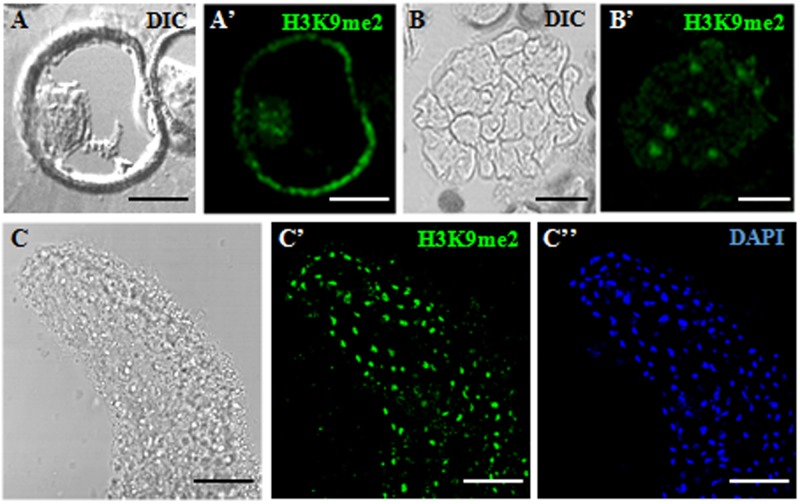
FIGURE 3.
Immunofluorescence of H3K9me2 during microspore embryogenesis initiation and progression of Brassica napus. Confocal laser scanning microscopy analysis of vacuolated microspores (A,A’), proembryos (B,B’) and cotyledonary embryos (C–C”). (A–C): Nomarsky’s differential interference contrast (DIC) images showing the cellular organization of the different structures. (A’–C’): H3K9me2 immunofluorescence signal over nuclei (green). (C”): DAPI staining of nuclei (blue) of a region of the cotyledon. The same structures are visualized under different microscopy modes in (A,A’), (B,B’) and (C–C”). The exine showed unspecific autofluorescence in some images (A’). Bars represent: (A,A’): 10 μm, (B,B’): 20 μm, (C–C”): 50 μm.

