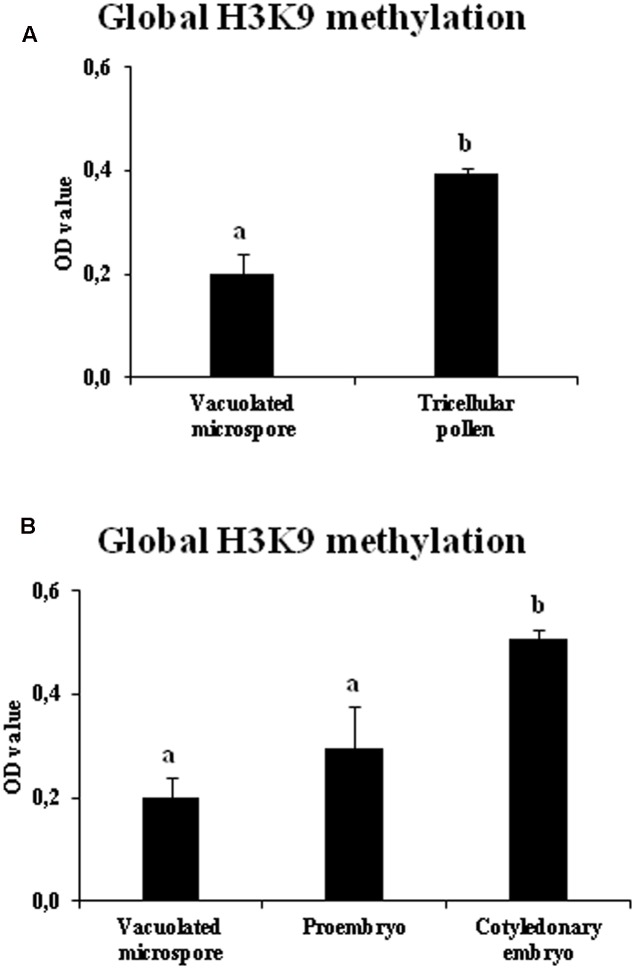
FIGURE 6.
Quantification of global H3K9 methylation during pollen development and microspore embryogenesis of Brassica napus. Histograms represent the amount of H3K9 methylation, in optical density (OD) units at 450 nm (see Materials and Methods), in different stages of the two microspore pathways, gametophytic development (A: vacuolated microspore and tricellular pollen), and microspore embryogenesis (B: vacuolated microspore, proembryo and cotyledonary embryo). Columns represent mean optical density (OD) units at 450 nm (±SEM). Different letters indicate significant differences according to ANOVA and Tukey’s test at p ≤ 0.05.

