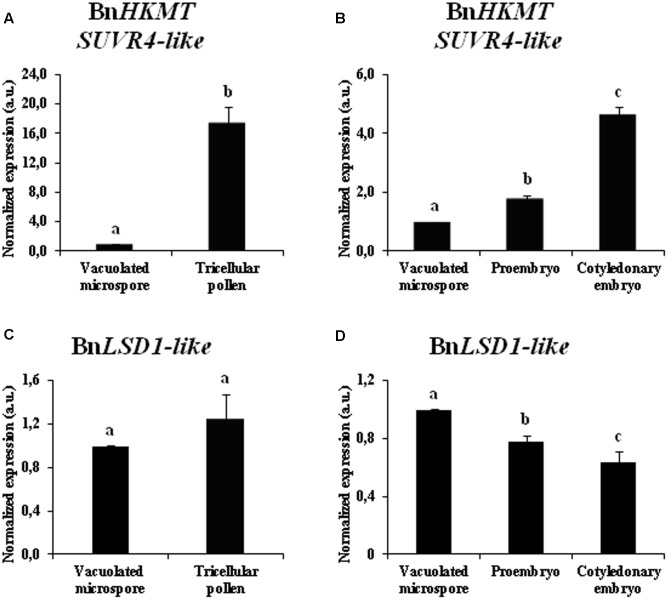
FIGURE 7.
Gene expression patterns of BnHKMT SUVR4-like histone methyltransferase and BnLSD1-like demethylase during pollen development and microspore embryogenesis of Brassica napus, by quantitative qPCR. Histograms express relative changes of expression at different stages of gametophytic development (A,C) and microspore embryogenesis (B,D): vacuolated microspore (starting point of the two pathways, before reprogramming), tricellular pollen (gametophytic pathway), proembryo and cotyledonary embryo (embryogenic pathway). Transcript levels were normalized to vacuolated microspore levels. Bars indicate the SEM. Different letters on columns indicate significant differences according to ANOVA and Tukey’s tests at p < 0.05.

