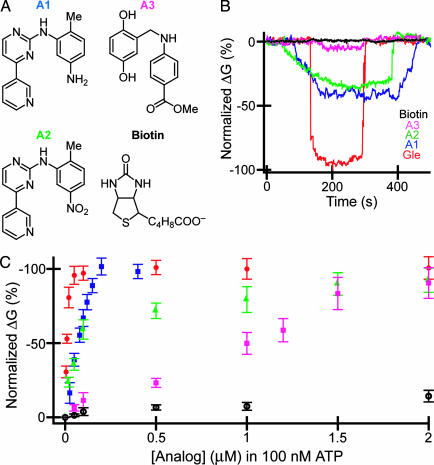
Fig. 4.
Screening of small-molecule inhibitors. (A) Structures of small molecules investigated for inhibition of ATP binding to Abl. (B) Normalized conductance vs. time data recorded from Abl-modified SiNW devices by using solutions containing 100 nM ATP and 50 nM small molecules for Gleevec (red), A1 (blue), A2 (green), A3 (pink), and biotin (black). The ATP and small molecules were dissolved in the same buffer as described in Materials and Methods. (C) Normalized change in conductance (ΔG) vs. small-molecule concentration in fixed 100 nM of ATP. The red, blue, green, pink, and black data points correspond to Gleevec, A1, A2, A3, and biotin, respectively. To correct for different absolute device sensitivity, the data were plotted as the normalized ΔG(ΔG, specific concentration)/(saturation ΔG) × 100%, where ΔG is the difference between the measured and baseline conductance.

