
Fig. 5.
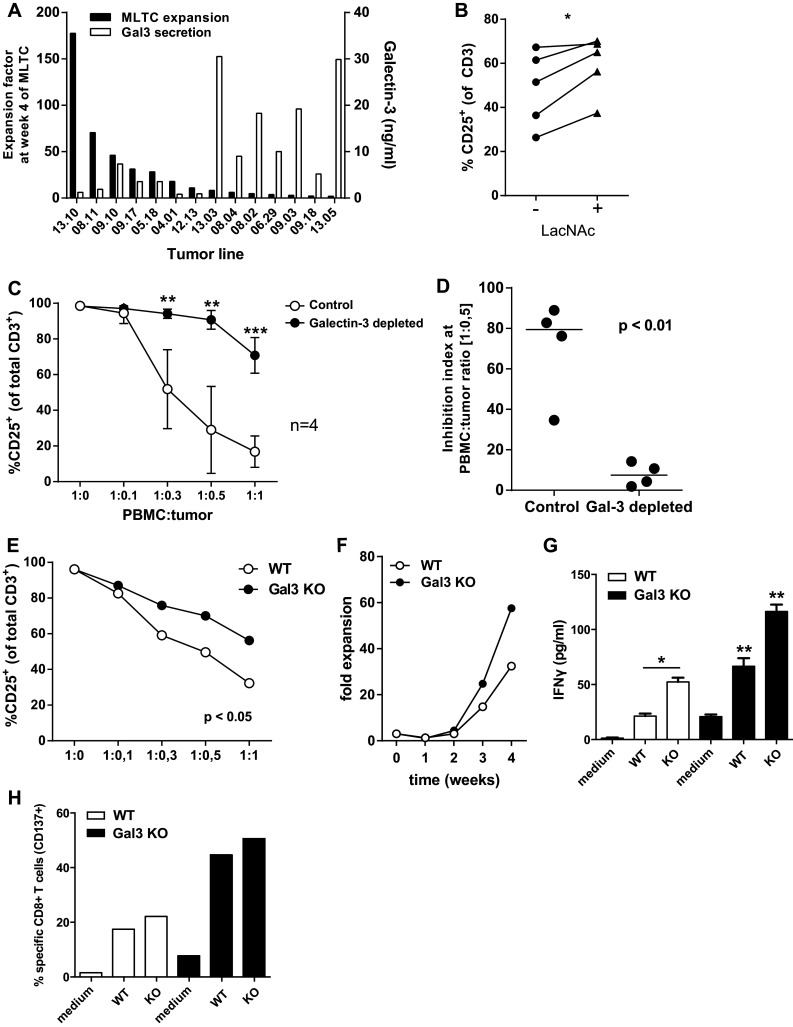
Galectin-3-mediated tumor cell induced T cell inhibition. a Comparison of the expansion factor of T cells at week 4 of the MLTC and the galectin-3 secretion in 48 h supernatant of the tumor cell lines used. b The percentage of CD25+ activated T cells in the short inhibition assay with or without the galectin-3 inhibitor LacNAc (5 mM). The difference between the conditions was analyzed using a one-way ANOVA with a Tukey post hoc test. c CD25+ activated T cells in the short inhibition assay performed with galectin-3 depleted TSN compared to non-depleted control TSN. Mean with SD for 4 different tumor cell lines (two-way ANOVA with multiple comparisons; **p < 0.01 and ***p < 0.001). d The inhibition index at a 1:0.5 PBMC to tumor cell ratio of the control condition compared to the galectin-3-depleted TSN (unpaired T test). e CD25+ activated T cells in the short inhibition assay performed with a galectin-3 knout-out tumor cell line compared to the wild-type tumor cell line (paired T test). f Expansion factors of T cells that were induced in an MLTC with autologous wild-type tumor cells and galectin-3 knock-out tumor cells. g IFNγ concentrations in the culture supernatant after overnight stimulation with autologous tumor cells of the T cell batches generated against the wild-type melanoma cells (white bars) and against the galectin-3 knock-out melanoma cells (black bars). T cell was stimulated with both the wild-type and galectin-3 knock-out tumor cells, as depicted on the x-axis. h Frequencies of tumor-specific (CD137+) CD8+ T cells in T cell batch after overnight stimulation with autologous tumor cells