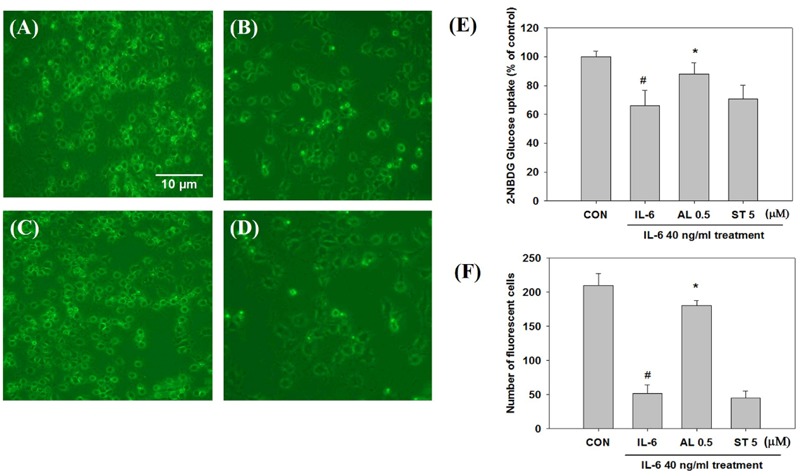
FIGURE 2.

Glucose uptake observation by fluorescence microscopy after staining with 2-NBDG (×200 original magnification). Each value represents mean ± SD (standard deviation) from triplicate measurements (n = 3). (A) CON+insulin (control with insulin treatment); (B) IL-6+insulin (40 ng/ml IL-6 24 h exposure with insulin treatment) Scale bar: 10 μm; (C) AL 0.5+IL-6+insulin (0.5 μM alantolactone pretreatment for 4 h and IL-6 24 h exposure with insulin treatment); (D) ST 5+IL-6+insulin (5 μM Stattic pre-treatment for 4 h and IL-6 24 h exposure with insulin treatment); AL, alantolactone; ST, Stattic. (E) Effects of alantolactone and Stattic on 2-NBDG Glucose uptake level after IL-6 exposure (n = 3, #p < 0.05 vs. insulin-stimulated control, ∗p < 0.05 vs. insulin-stimulated IL-6). (F) Number of fluorescent cells after 2-NBDG glucose uptake quantified by using an image J program.
