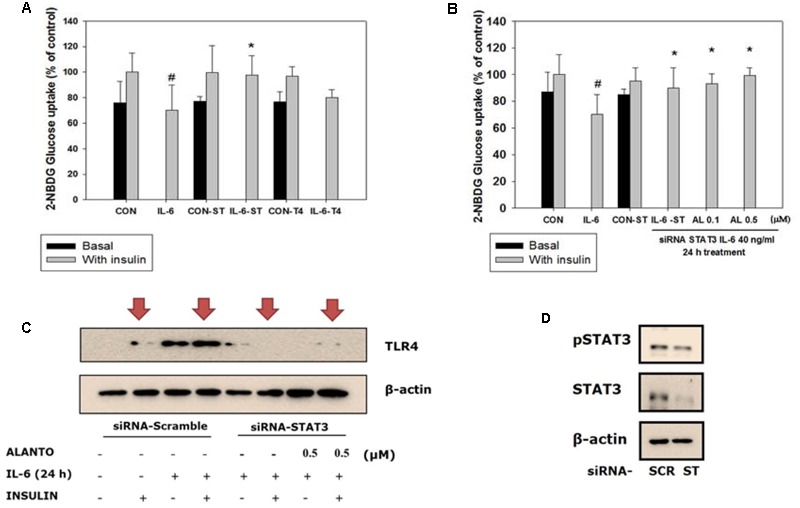
FIGURE 4.

Silencing of STAT3. Each value represents mean ± SD (standard deviation) from triplicate measurements (n = 3). (A) L6 transfection with siRNA-STAT3 for 72 h followed by 40 ng/ml IL-6 for 24 h (n = 3, ∗p < 0.05 vs. insulin-stimulated IL-6-SC); CON-SC, control-scrambled-siRNA; IL-6-SC, IL-6 treated-scrambled siRNA; CON-ST, control-siRNA STAT3; IL-6-ST, IL-6 treated-siRNA STAT3; CON-T4, control-siRNA TLR4; IL-6-T4, IL-6 treated-siRNA TLR4. (B) 2-NBDG glucose uptake of siRNA-STAT3 and siRNA-TLR4. SiRNA-STAT3 reversed IL-6 induced insulin-stimulated glucose uptake level to the control (n = 3, ∗p < 0.05 vs. insulin-stimulated IL-6-SC); A, alantolactone. (C) Western blot of IL-6 induced insulin-stimulated scrambled-siRNA on TLR4 gene expression (n = 3). (D) Western blot of scrambled-siRNA and siRNA-STAT3. #p < 0.05 vs. insulin-stimulated control.
