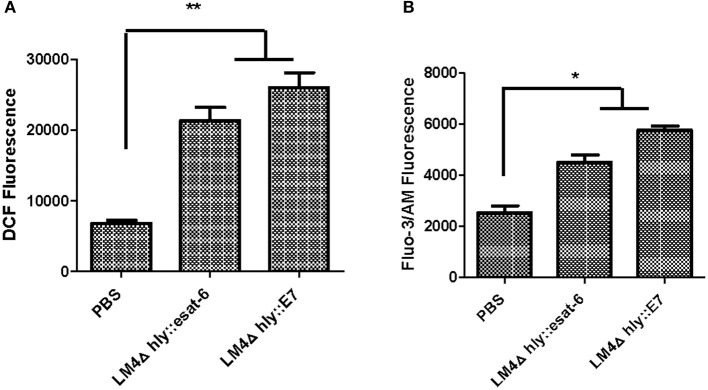
Figure 8.
The level of intracellular ROS and Ca2+ in tumor cells from rLM-treated mice. Tumors were excised 7 days after the final vaccination, and processed into single cell suspensions. The cells were then stained with DCFH-DA dye assay or Fluo-3 AM assay, and the intracellular ROS (A) and Ca2+ levels (B) were determined by flow cytometry. Data are expressed as the mean and SD values from three independent experiments. *P < 0.05; **P < 0.01, Student's t-test.

