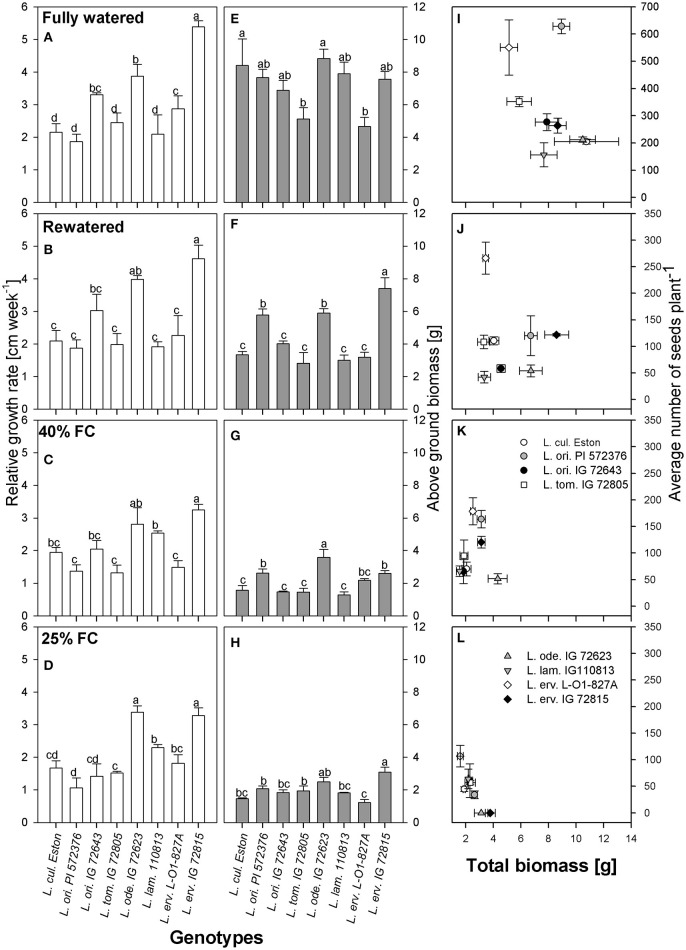
Figure 2.
Comparisons of relative growth rate (A–D), above ground biomass (E–H), and the relationship between total biomass and number of seeds produced (I–L) between cultivated and wild lentil genotypes and within wild lentil genotypes that were grown under four conditions: fully watered, allowed to dry to 40% of field capacity (FC) and then re-watered, and allowed to dry to 40 or 25% FC and maintained at that level. Different lower case numbers denote significant differences at α = 5% at a given moisture level.

