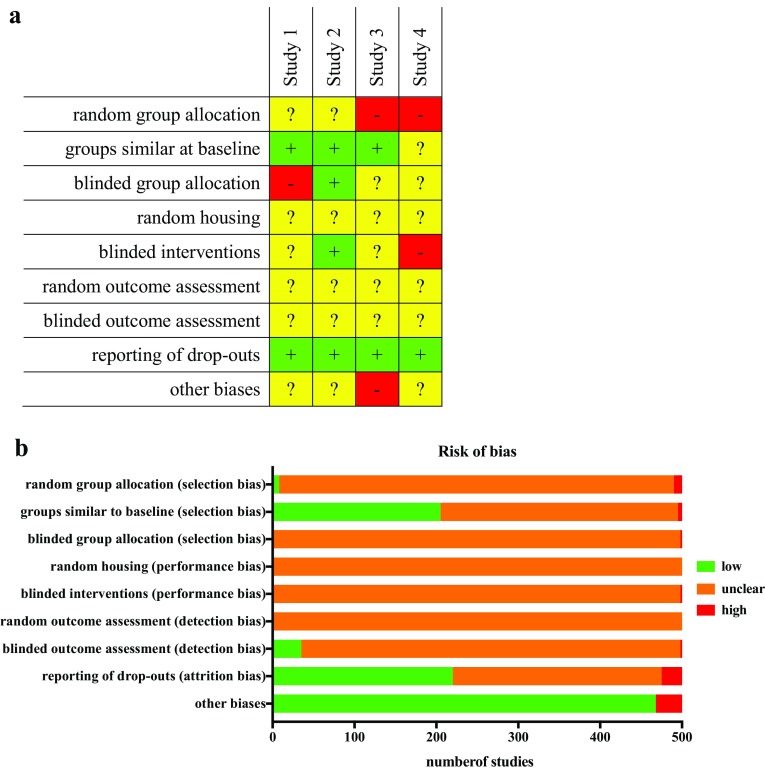
Fig. 3.
Representative summary table (a) for the risk of bias assessment [green cells with (plus): low risk of bias; yellow cells with (question mark): unknown risk of bias; red cells with (hyphen): high risk of bias] and representative summary (b) of risk of bias analysis across studies (reproduced from Wever et al. 2015)

