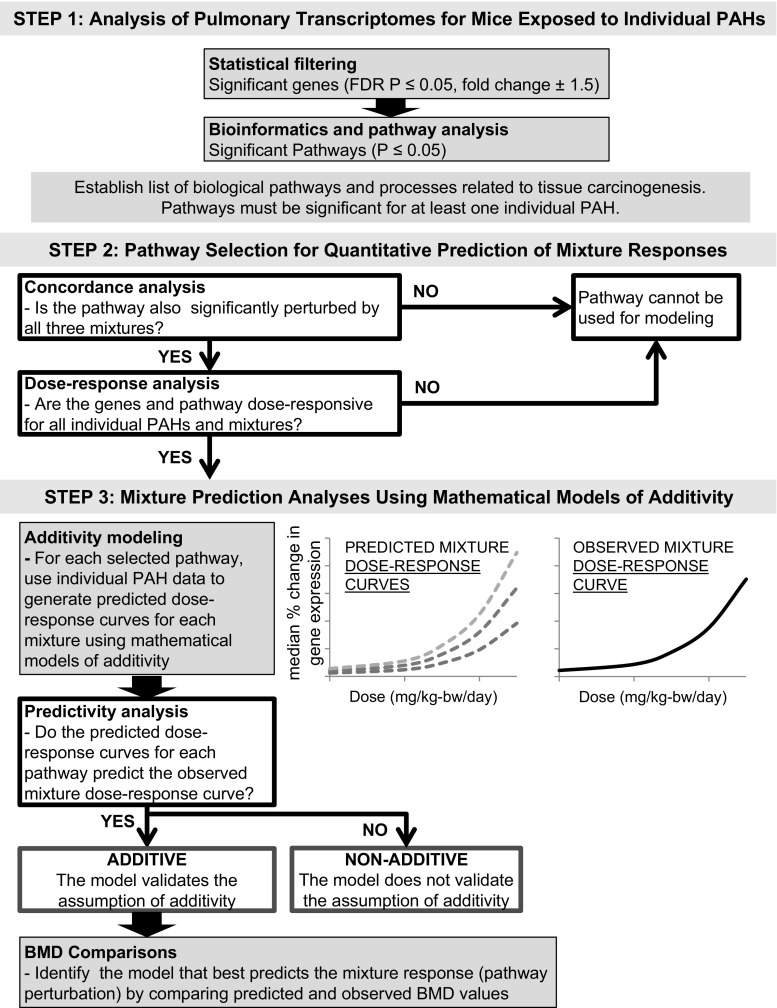
Fig. 1.
Workflow to select pathways for mathematical modeling and mixture prediction analyses. In step 1: analysis of pulmonary transcriptomes for mice exposed to individual PAHs, following statistical filtering and bioinformatics and pathway analysis, pathways were selected based on cancer-related biological pathways and processes perturbed by the individual PAHs examined in Labib et al. (2015). The number of significant genes and significant pathways induced by each PAH are shown. In step 2: pathway selection for quantitative prediction of mixture responses, pathways were selected following concordance and dose–response analyses (white boxes). Pathways that did not pass concordance and dose–response analyses were not used for mathematical modeling. In step 3: mixture prediction analyses using mathematical models of additivity, the individual PAH data were used to generate predicted dose–response curves for each mixture using three established mathematical models of additivity—concentration addition (CA), generalized concentration addition (GCA), and independent action (IA). The predicted dose–response curves and the BMDs for the predicted dose–response curves were compared with the observed mixture dose–response curves and BMDs for the observed dose response curves in the predictivity analysis and BMD comparison

