
Fig. 4.
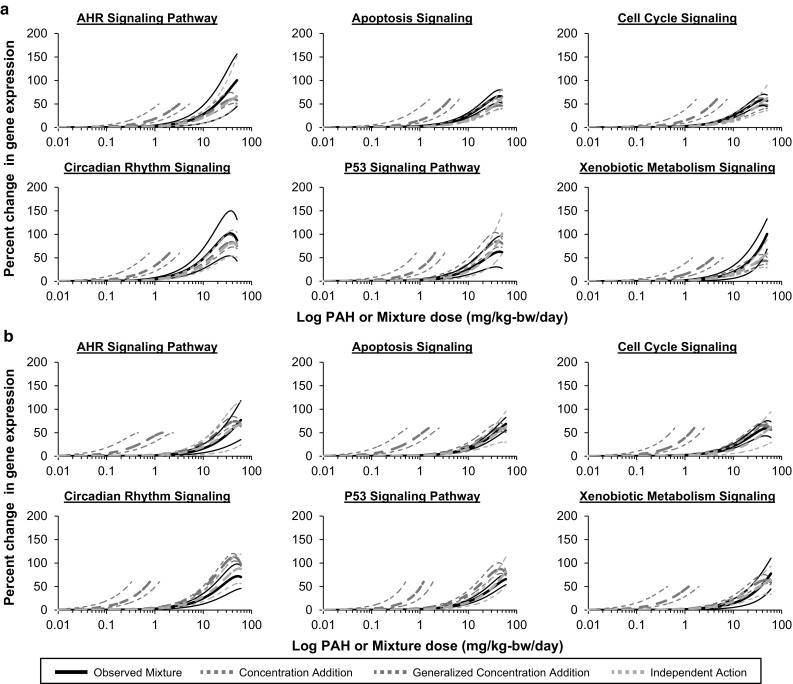
Comparisons of predicted and observed mixture effects for a a mixture of four PAHs and b a mixture of eight PAHs. Using individual, single-PAH dose–response relationships, additive effects were predicted using the models of concentration addition (CA; blue dotted lines), generalized concentration addition (GCA; purple dotted lines), and independent action (IA; orange dotted lines). Observed dose–response curves are represented by solid black lines. Thin lines represent 95% confidence bands (color figure online)