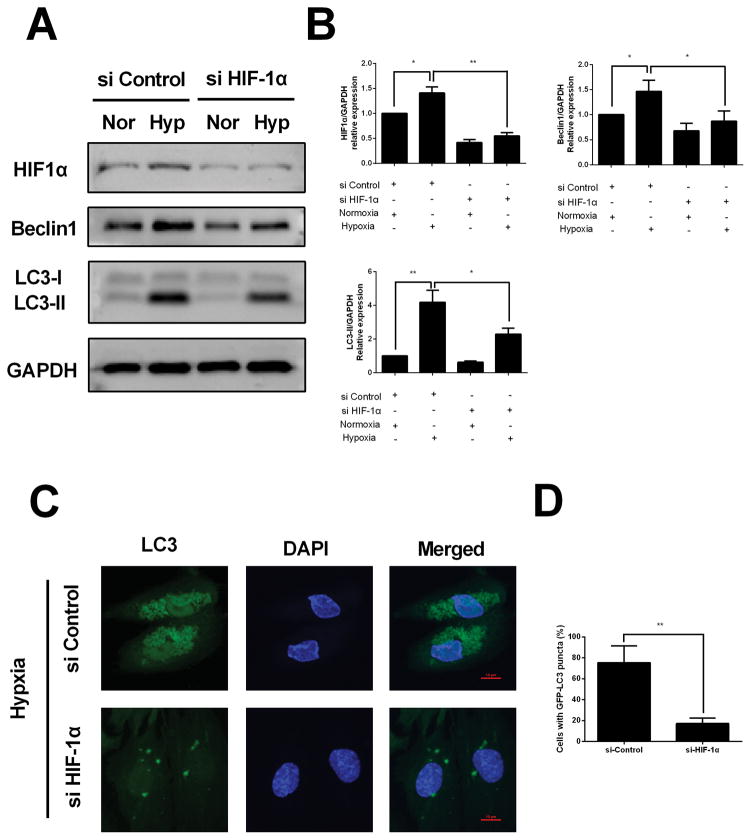
FIGURE 4. Knockdown of HIF-1α interferes with hypoxia-induced autophagy in HESCs.
(A) Representative western blots of HIF-1α, Beclin1 and LC3 protein in HESCs transfected with scrambled control siRNA or HIF-1α specific siRNA in the presence or absence of hypoxia. (B) The protein expression levels were quantified by Image J software and normalized to GAPDH protein levels. The data are presented as the means ± SD from at least three independent experiments (*p<0.05;**p<0.01; ***p<0.001 by one-way ANOVA). (C) Detection of GFP-LC3 puncta indicative of autophagy in HESCs transfected with scrambled control siRNA or HIF-1α specific siRNA under hypoxia condition for 24 hours. Photographs were taken at magnifications of 1600×. (D) Quantification of the percentage of cells displaying punctate GFP-LC3 using ImageJ. The data are presented as the means ± SD from at least three independent experiments (*p<0.05;**p<0.01; ***p<0.001 by Student’s t test).

