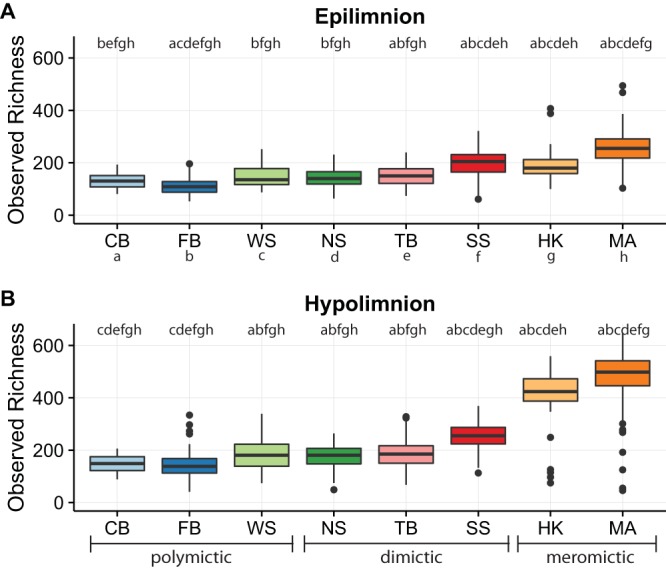
FIG 1 .

Richness by layer and lake. Lakes listed on the x axis are arranged by depth (see Table 1 for lake abbreviations and depth measurements). Significance (represented by letters for each lake above their box plot; the letters identifying each lake are below the x axis in panel A) was tested using a Wilcoxon signed-rank test with a Bonferroni correction for multiple pairwise comparisons, reported in Table S1. (A) Epilimnion. (B) Hypolimnion.
