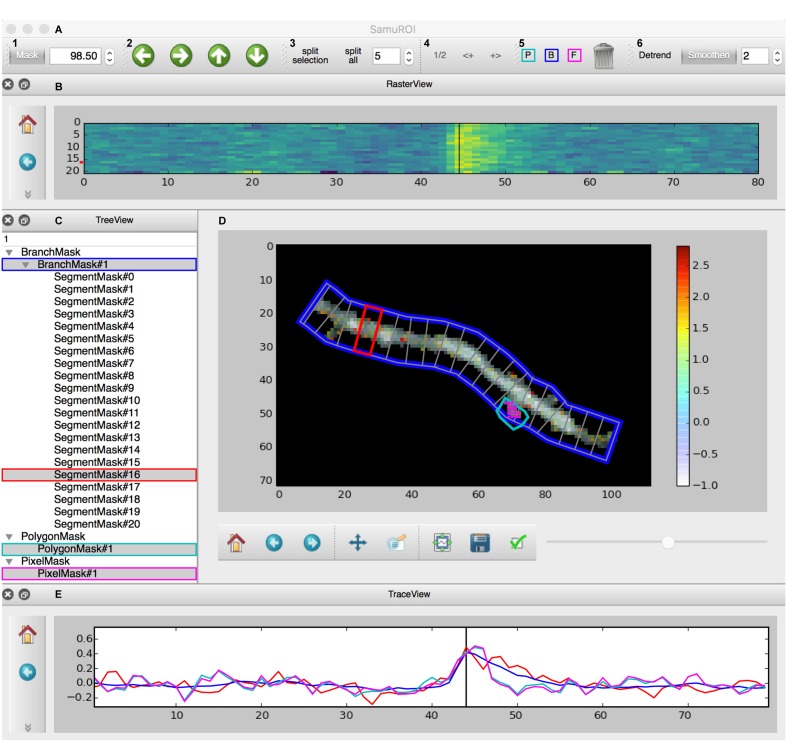
FIGURE 2.
Screenshot of the GUI. (A) Toolbar: (A1) Allows the user to set a numeric cut-off value for the thresholding overlay mask. The thresholding overlay mask defines irrelevant background fluorescence and spares relevant pixels in the morphology image. (A2) Permits pixel-wise shifting of selected ROI masks in the direction of the arrows. (A3) Defines the width of branch sub-segments arranged perpendicular to the all BranchMasks (split all) or only the selected BranchMask (split selection). (A4) Permits grouping adjacent segments or splitting the selected segments in half. In tab (A5), the different mask drawing tools for PixelMasks (P, turquoise), BranchMasks (B, blue) and freehand PolygonMasks (F, magenta) can be selected. Selected masks can be deleted using the trashcan icon in this tab. Tab (A6) hosts the Detrend and Smoothen postprocessors. The degree of smoothing (moving average filter) can be defined using the number tab. (B) The RasterView widget visualizes the temporal and spatial distribution of the fluorescent Ca2+ signal over the segments of a selected BranchMask. Points on the y-axis corresponds to the segment number, the x-axis defines the frame number. The amplitude of the averaged fluorescent signal of a given segment is color-coded. The vertical black line between frames 40 and 50 corresponds to the slider button and the currently selected frame in (D) and the line in the TraceView (E). The panel on the left gives access to standard matplotlib functions like for example zooming, panning or exporting of subplots as image files. Similar panels can be found in the FrameView (D) and TraceView (E) widgets. (C) The TreeView widget gives access to the ROI mask list. Different types of masks are grouped and selected masks are highlighted in gray. Names of the different ROI masks are indexed by default, but can be changed directly in the TreeView widget. (D) The image in the FrameView widget is a composite of the grayscale image of the morphology object with the thresholding overlay mask and the color-coded pixel brightness of the currently selected frame. The x- and y-scale corresponds to single pixels. ROI masks are projected on this image in light gray, selected ROI masks are highlighted in colors corresponding to traces demonstrated in (E). The corresponding color code in (C) and (A5) is just for illustration. The scale bar on the right illustrates the color code for frame-specific pixel brightness. (E) In the TraceView widget, the relative change in brightness (in our example, the ΔF/F value) of the selected ROI mask(s) is plotted against the frame number.

