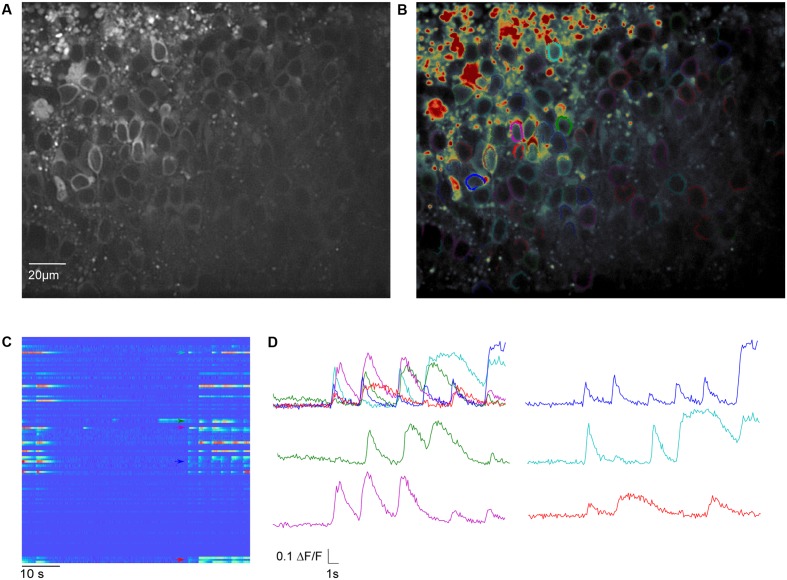
FIGURE 4.
Meso-scale imaging example for using SamuROI neuronal populations in the piriform cortex of a brain slice. (A) 40× magnification GCaMP6f-fluorescence summed image of a horizontal slice from the AI95/NexCre mouse in layer 2 of the piriform cortex. (B) The summed image loaded into SamuROI in FrameView with an overlay of color-coded cellular ROIs obtained with our mask generating function. (C) The RasterView displays all ROIs that are plotted. It depicts the temporal and spatial profile of neuronal activity induced changes in GCaMP6f fluorescence during a spontaneous synchronous network event. The colored arrows correspond to the highlighted cells in (B). (D) Fluorescence traces corresponding to segments color-coded in (B) and (C). Arrows in (C) depict the starting points of the corresponding traces.

