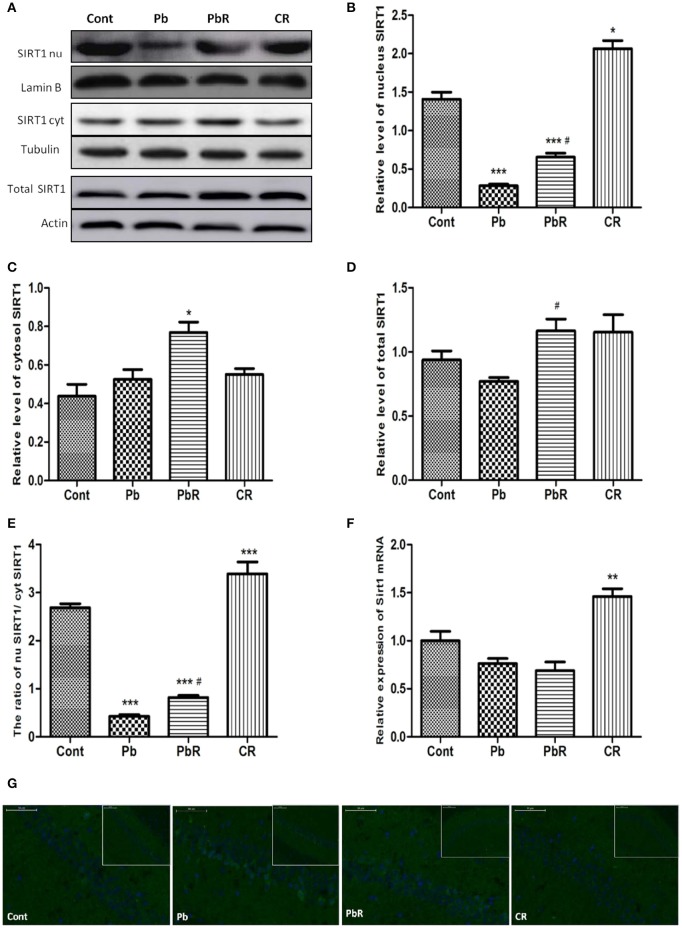
Figure 6.
Effects of resveratrol on SIRT1 expression in nucleus depleted by Pb exposure. (A–E) Representative Western blot and quantitative results for SIRT1 level in nucleus and cytosol of hippocampus. The densities are normalized to β-actin, β-Tubulin or Lamin B respectively. (F) The endogenous Sirt1 transcript levels were determined by RT-qPCR from mice hippocampal homogenates of each group. Quantitative results for each sample normalized by GADPH. Values are expressed as mean ± SEM (n = 6). (G) Localization of SIRT1 in CA1 region of mice hippocampus observed under fluorescence microscope. SIRT1 is shown in green, DAPI staining in blue. *P < 0.05, **P < 0.01, ***P < 0.001 compared to Cont group; #P < 0.05 compared to Pb group.

