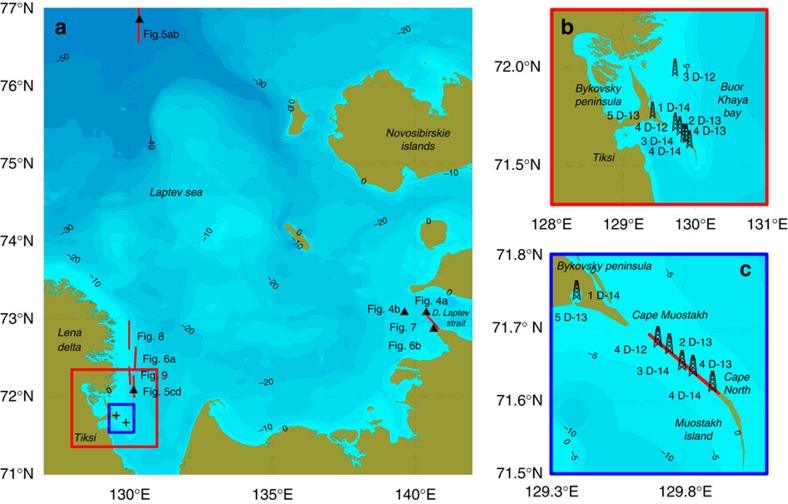
Figure 1. Study area bathymetry and position of the investigated sites.
(a) Red and blue rectangles mark study areas, where drilling was conducted in 2011–2014, position of the sites investigated in marine expeditions, data from which are presented in Figs 4, 5, 6, 7, 8, 9 are shown as black triangles (2D sites) and red lines (transects); two black crosses in the blue rectangle show position of the drilling transect conducted in 2012–2014 (shown enlarged in b,c); (b) position of the boreholes drilled in March 2011–2013; (c) enlarged position of the drilling transect performed the northern part of MI in 2012–2014.

