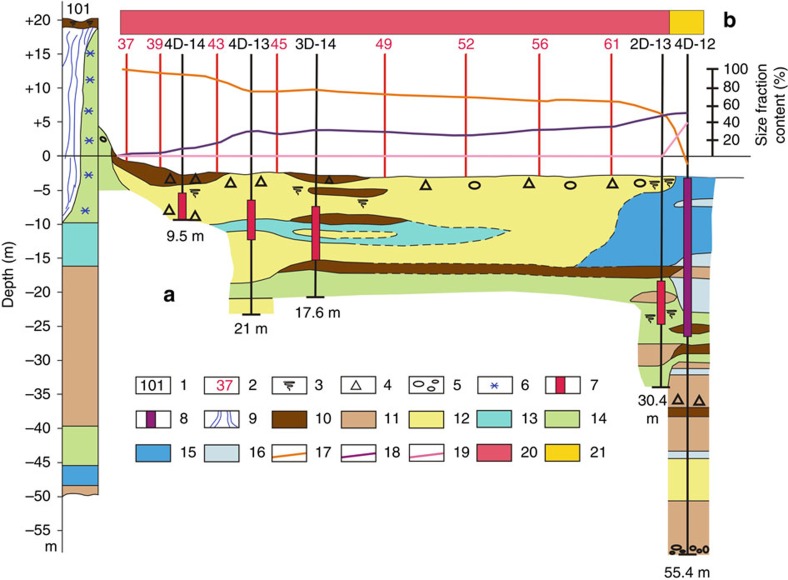
Figure 2. Geomorphological structure of the sediments along the drilled transect in the near-shore zone of the ESAS.
(a) Cross section from Cape North, MI towards Cape Muostakh, Bykovsky Peninsula with marked positions of the re-drilled boreholes. Boreholes 4D-14 (former 301), 4D-13 (former 303), 3D-14 (former 304) and 2D-13 (former 305) are re-drilled boreholes; borehole 4D-12 is the borehole drilled for the first time. Red spikes identify changes in the position of the IBPT in drilled boreholes during the last 31–32 years; purple spike in borehole 4D-12 show change in the position of the IBPT since the time of inundation. The top of the red/purple spike marks the former top of the IBPT; the low end of the spike marks the recently observed IBPT; numbers below each borehole show the length of recovered sediment cores. (a) 1—marks of drilled boreholes; 2—marks of sediment sampling sites; 3—plant remains within sediments; 4—gravel; 5—pebbles; 6—frozen ground in the coastal IC; 7—change in position of the IBPT during the last 31–32 years (boreholes 4D-14, 4D-13, 3D-14 and 2D-13); 8—change in position of the IBPT in borehole 4D-12 (since inundation); 9—wedge-like structure of ice in the coastal IC; 10—medium sand; 11—fine sand; 12—silty sand; 13—sandy silt; 14—clayey silt; 15—silty clay; 16—clay; (b) shelf-ward dynamics in grain-size distribution in sediments collected at 5 cm depth at selected sites along the transect (weight-% of major size fractions): 17—change in contribution of sands (>0.1 mm); 18—change in contribution of silt (0.1–0.01 mm); 19—change in contribution of clay (<0.01 mm); shift in sedimentology from predominant contribution of large-medium grain-size fractions (20) to medium-fine grain-size fractions (21).

