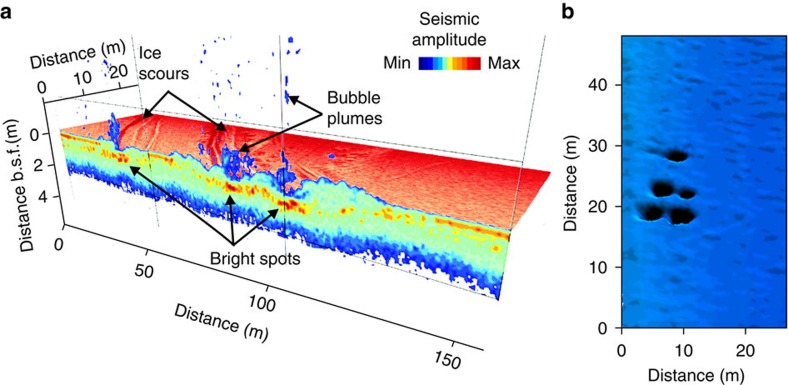
Figure 6. Specific morphological features of the seabed and the seafloor observed in the study area.
(a) Three-dimensional coloured view of sub-bottom morphology based on interpretation of high-resolution sub-bottom profile data (vertical profile) combined with side-scan backscatter data; colour variations refer to the amplitude response of the seabed (maximum shown in red, minimum shown in blue). Morphological features within sediments with highest amplitudes are shown as bright spots (red-orange colours). As seen from the image, bubble releases to the water occur where ice sours unroof shallow gas accumulations in the seabed; b.s.f. refers to below seafloor; (b) a view of multi-beam sonar backscatter data used to detect typical pockmarks in the seafloor in the study area where submerged thaw lake was identified as shown in Fig. 7.

