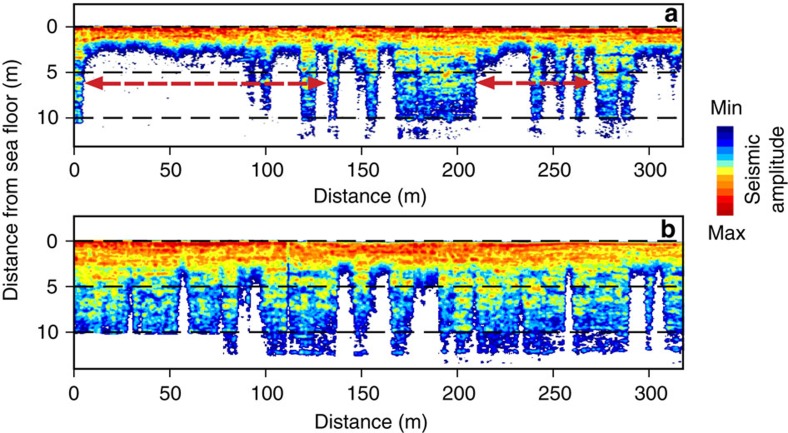
Figure 8. Upward movement of gas front observed in the same area of investigation in two subsequent years.
(a) A high-resolution sub-bottom profile image is interpreted based on colour variations referring to change from maximum seismic amplitudes (shown in red) to minimum amplitudes (shown in blue). Blanked (or washed-out, shown in white) zones are interpreted as attenuated and scattered by gas bubbles (acoustic turbidity)28,46. The upper boundary of the blanked zone indicate position of the gas front in 2012, ∼2 m below the seafloor; red arrows indicate areas of most pronounced upward movement, ≤5 m during 1 year; (b) a high-resolution sub-bottom profile image shows that the upper boundary of the blanked zones in 2011 is located ≤10+ m below the seafloor, in the same areas marked with red arrows in a; blanked or semi-blanked acoustic anomalies are interpreted as gas-charging sediments based on validation by drilling (see Fig. 9).

