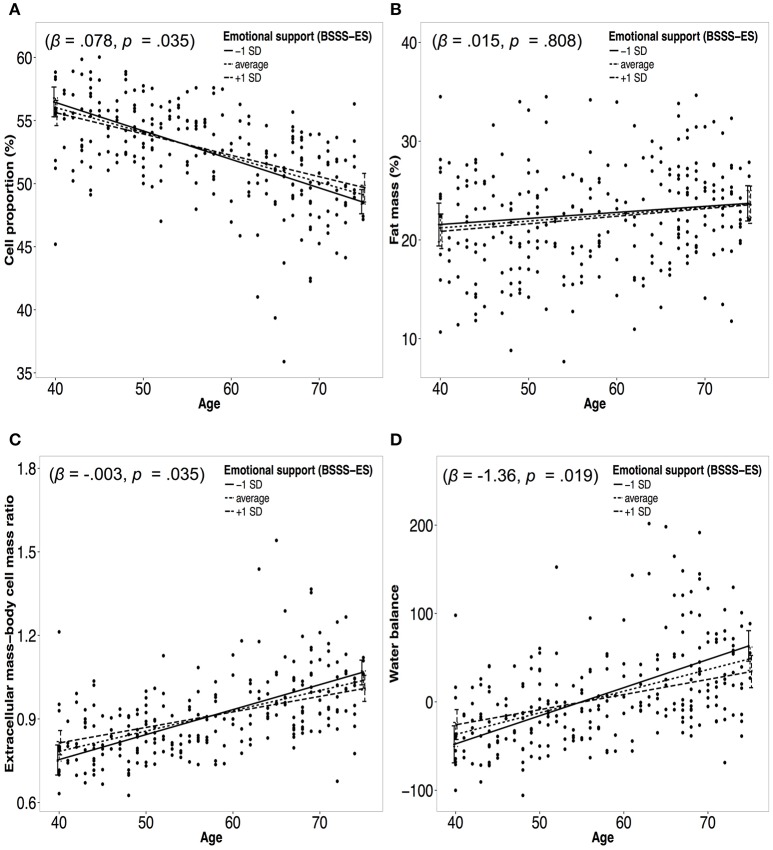
Figure 2.
Panels (A–D) represent moderation plots of the relationship between age and body composition moderated by emotional support. Dotted lines represent the association between age and a measure of body composition for average emotional support. Solid/dashed lines represent the association between age and a measure of body composition for emotional support one standard deviation (SD) below/above the mean. Panel (A) represents the moderation effect of emotional support on the association between age and cell proportion. Panel (B) represents the moderation effect of emotional support on the association between age and fat mass. Panel (C) represents the moderation effect of emotional support on the association between age and extracellular mass-body cell mass ratio. Panel (D) represents the moderation effect of emotional support on the association between age and water balance.

