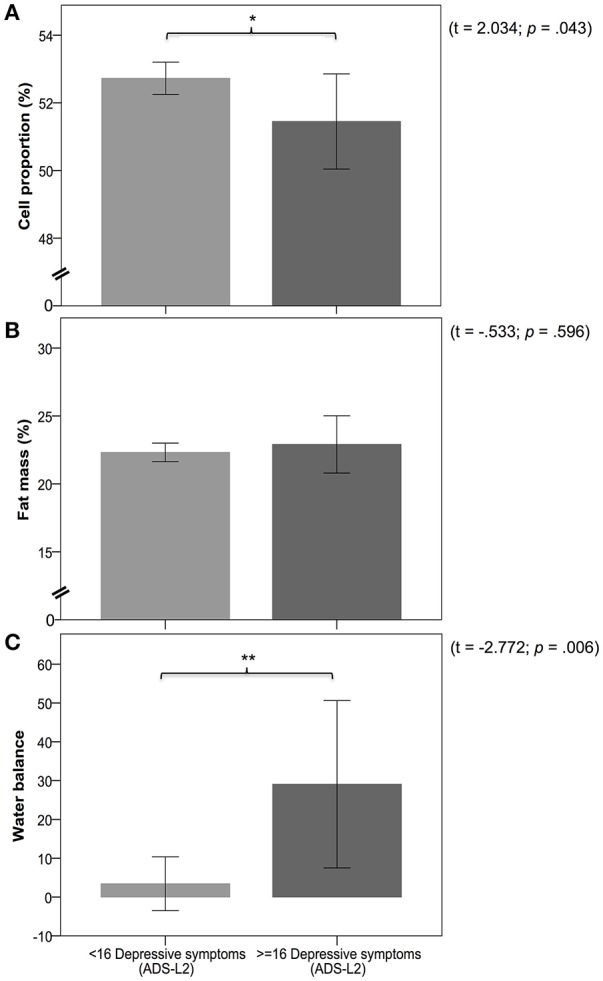
Figure 3.

Panels (A–C) represent the differences in measures of body composition between the low (< 16 depressive symptoms) and moderate (≥16 depressive symptoms) depressive symptoms group. Panel (A) shows a comparison of cell proportion between groups. Panel (B) shows a comparison of fat mass between groups. Panel (C) shows a comparison of water balance between groups. Legend: * and ** indicate significance at p < 0.05 and p < 0.01.
