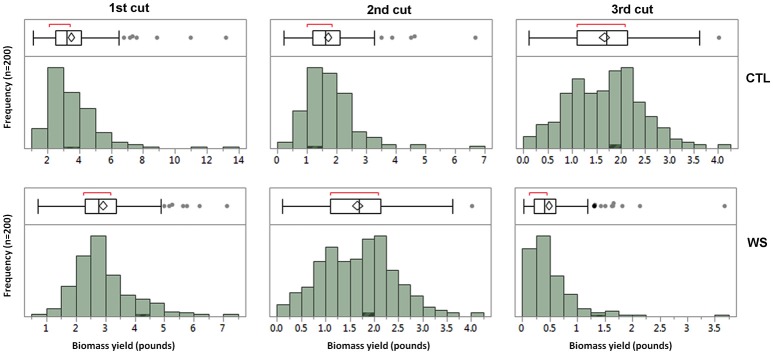
Figure 1.
The distributions of biomass yields under well-watered control (CTL) and water stress (WS) from three cuttings in the field trial. The means of biomass in fresh weight were used for analyzing the normality of distributions in the 1st, 2nd, and 3rd cuttings. The bars of each panel show the frequency of distribution and the box plots show the pick regions of distributions.

